What commercial vehicle data do transportation planners use most?
See the 3 commercial vehicle datasets transportation planners use most — harsh events, speed analysis, and origin-destination data — with real examples.

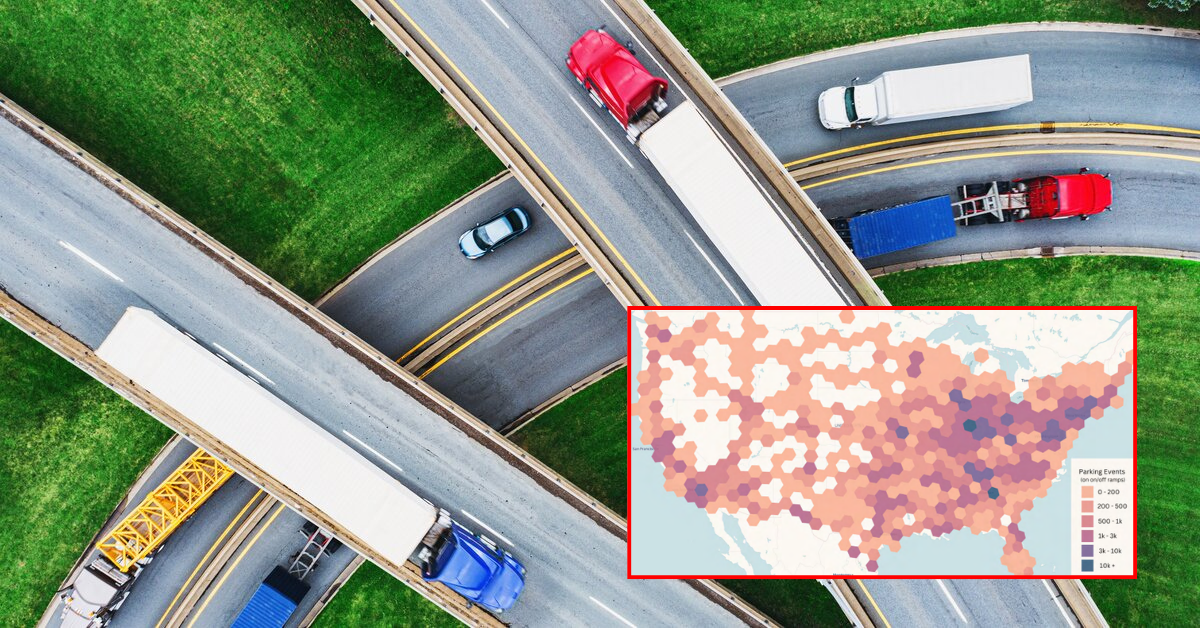
If you’re wondering what truck parking data is available for transportation agencies, the answer used to be: not much beyond anecdotal reports and complaint logs. Altitude’s telematics-driven analysis of over 120,000 heavy-duty truck ramp parking events across the U.S. changes that. From journey thresholds tied to Hours-of-Service limits to hour-by-hour demand peaks and rural-urban parking splits, this data gives transportation planners a way to move past “we know parking is a problem” and toward targeted, fundable answers about exactly where and when corridors need capacity.
Our report found that for trucks parked overnight on ramps, the median travel before parking is 520 miles and 9.7 hours. This correlates with mandated hours-of-service limits that kick in at 11 hours of driving. This correlation shows that ramp parking clusters at the edge of that driving limit, and it means the problem is predictable.
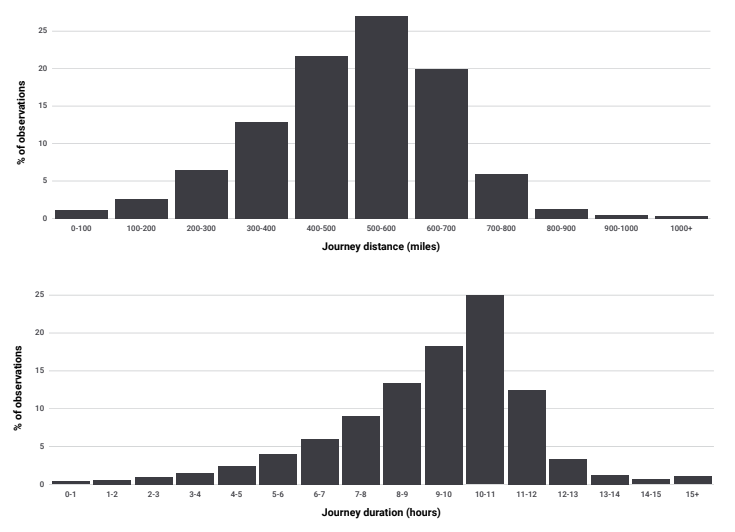
Using this metric, planners can model where trucks departing from major hubs will “run out of road” under HOS rules. An Origin-Destination analysis of the trucks traveling through your corridors can validate and refine that model. Then capacity investments can target those corridor segments so trucks can find parking when and where they need it.
Knowing when demand hits is just as useful as knowing where. Our research shows an overnight concentration from 8pm to 5am for ramp parking, with weekday peaks on Tuesday and Wednesday.
Seeing that midweek peak, planners can prioritize enforcement, signage or temporary overflow measures on the nights and hours that matter most. Given that most parking is overnight, safety considerations also kick in. Nighttime visibility is low and drivers stopped on ramps are hard to see, creating a clear safety/crash-risk concern.
Our parking report identified an event volume-to-frequency conversion rate. This rate establishes a metric for converting annual ramp parking counts into how many trucks are parked out there on a single peak weeknight. For example, 100,000 ramp parking events per year converts to 57 trucks parked on any given Tuesday at 9pm.
| Annually observed ramp parking events | Corresponding ramp parking events on an average Tuesday night at 9:00 p.m. |
|---|---|
| 100 | <1 |
| 1,000 | 1 |
| 5,000 | 3 |
| 10,000 | 6 |
| 20,000 | 12 |
| 30,000 | 17 |
| 70,000 | 40 |
| 100,000 | 57 |
Used as a practical planning tool, this table can convert an abstract annual statistic into a concrete “how many trucks may be parked during a typical peak period?” data point. Not only does that add concreteness to conceptualizing the problem, but that specific weekday parking data is useful for capacity design, corridor prioritization or funding applications like INFRA grants.
Ramp parking isn’t just an urban problem. In fact, our study found that about 30% of long-duration ramp parking events took place in rural areas along major freight corridors. This metric is useful in a more contextual sense than it is for supporting specific reports or plans. It argues for a national corridor strategy, or at the very least jurisdiction coordination. It also invites planners in rural areas to quantify the true extent of area ramp parking, and its potential to grow.
Although our study doesn’t include industry data, Altitude’s platform has that capability. Added to a truck ramp parking analysis, industry insights can help planners identify what economic sectors need supporting. Understanding industry breakdown can support grant narratives and build community engagement.
Together, these truck parking metrics enable planners to shift from the anecdotal observation of “there’s not enough truck parking” to a far more targeted argument. Bolstered by specific corridors, specific overnight windows, specific journey lengths and specific industries, funding initiatives can target proven, prioritized needs.
See the deeper analysis and get more truck ramp parking metrics in our nationwide study of truck ramp parking events.
Ramp parking is largely driven by a combination of federal Hours-of-Service regulations and a nationwide shortage of truck parking capacity. Drivers approaching their 11 hour driving limit often have no authorized parking available nearby, so they stop wherever they can, including on-ramps and off-ramps. The data shows this isn’t random: the median journey before a ramp parking event is 520 miles and 9.7 hours, putting it right at the edge of the federal limit.
Both, though not equally. While major metro hubs see the highest absolute volume of ramp parking events due to traffic density, about 30 percent of long-duration ramp parking events occur in rural counties along major freight corridors. This means agencies can’t treat ramp parking as a metro-only issue, and rural corridor planning deserves its own attention alongside urban capacity projects.
Ramp parking concentrates overnight between 8pm and 5am, with Tuesday and Wednesday seeing the highest weekly volumes. This overnight timing raises safety concerns since visibility is low and parked trucks are harder for passing drivers to see, making these hours a priority for enforcement, signage and temporary overflow solutions.
Agencies can pair journey threshold data, peak demand windows and the annual-to-weeknight conversion table to build a specific, evidence-based case rather than relying on general observations about parking shortages. For example, converting an annual count like 100,000 ramp parking events into a concrete figure like 57 trucks parked on a given Tuesday night gives planners a tangible data point for corridor prioritization and applications to programs like INFRA grants.
See the 3 commercial vehicle datasets transportation planners use most — harsh events, speed analysis, and origin-destination data — with real examples.
A data-driven look at event traffic management across 16 stadium cities, with takeaways city planners can apply to future large-scale events.
Identify freight bottlenecks before they cost you. Discover 4 early-warning metrics planners use to spot corridor risks and strengthen grant applications.