

A planner’s checklist: What telematics data can (and can’t) do for freight planning
Telematics data for freight planning complements traditional sources. Our checklists share what telematics data can and can’t do to support freight planning.

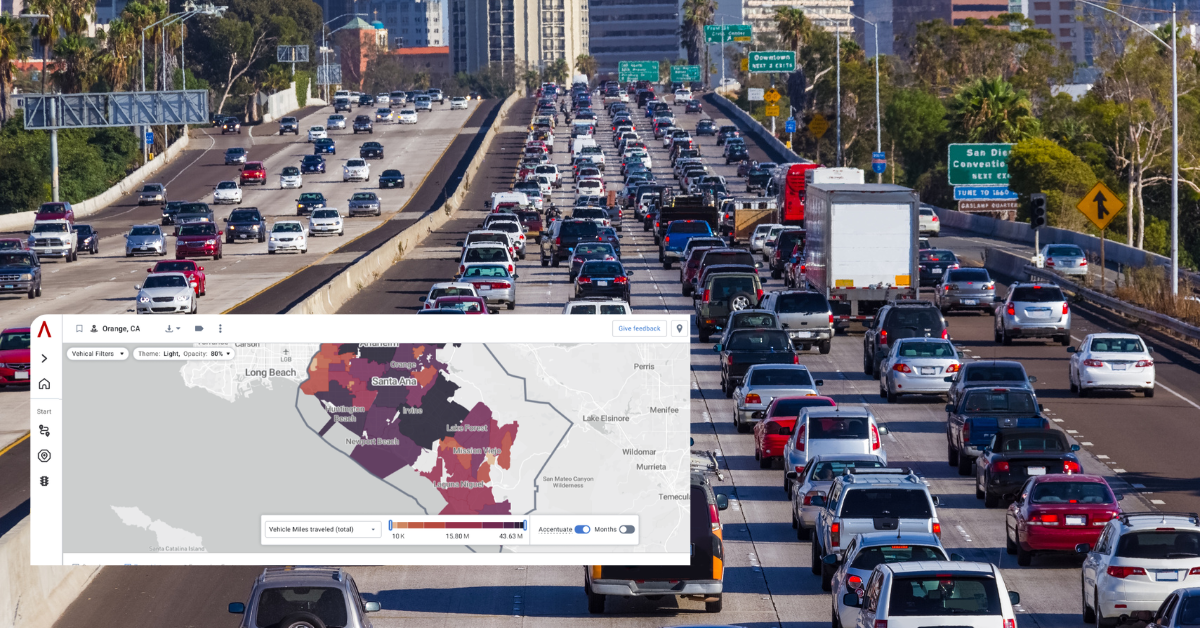
Freight bottlenecks can be identified by tracking four early-warning indicators: 1) VMT trends, 2) speed degradation, 3) Origin & Destination patterns and 4) mode-shift potential. Tracking these metrics gives planners advance notice before corridors appear on annual congestion lists.
That’s because freight bottlenecks don’t appear overnight. They build slowly and invisibly, long before they show up on official lists or trigger a major capital project. By the time a corridor makes an annual “top bottlenecks” ranking, the economic damage is already well underway, causing higher fuel consumption, wasted labor hours, elevated inventory carrying costs and reduced supply chain reliability.
That costs real dollars. In California alone, where Los Angeles holds the nation’s highest congestion ranking, drivers lose an estimated 100 hours per year sitting in traffic. Congestion problems add a 20% – 250% surcharge to freight costs according to a 202 analysis from the Federal Highway Administration. In our recent analysis of all 50 state freight plans, we found that 66% of states identified bottleneck mitigation as a top priority for 2026.
Fortunately, you now have access to stronger freight evidence to meet federal review standards by identifying not only current bottlenecks but emerging ones far before they become expensive problems.
When you rely on traditional bottleneck lists, the problem is often well developed before it ever triggers traditional freight corridor congestion signals.
The stronger approach is to flip that model, capturing freight movement insights that surface early warning congestion indicators and help you prioritize corridors using defensible, consistent metrics that win grant approvals. Instead of reacting to congestion, you can forecast it.
You can build this early-warning system using a combination of key freight indicators, including:
Together, these metrics give you a defensible framework to rank corridors, understand root causes and select the most effective mitigation strategies.
VMT continues to be one of the most critical indicators of corridor health. Truck parking studies offer planners granular data that can be used for highway calibration and validation, particularly for understanding how to reduce VMT on overloaded corridors.
By tracking VMT trends, your team can pinpoint where traffic is outpacing infrastructure and capture the early evidence needed to justify capacity upgrades or preservation projects. And because the data is corridor-specific, it can directly support competitive funding applications, including Trade Corridor Enhancement Program (TCEP) grants.
Freight often slows down long before it shows up in congestion and bottleneck rankings. Speed degradation metrics reveal early bottleneck indicators by showing where freight slows down, when those slowdowns occur, whether delays are spreading or intensifying and which vehicle types are affected.
These metrics help planners distinguish between a momentary slowdown and a developing structural problem giving you a head start on mitigation before the issue surfaces in crash data or public complaints.
Not all congestion is caused by local freight. An Origin & Destination analysis shows where freight travel ultimately begins and ends, revealing:
These are the differentiating details that guide more precise bottleneck solutions.
Dig into what the data suggests. For example, a recent analysis of Florida’s I-75 corridor shows that most of that corridor’s long-haul freight trips bypass Atlanta by routing westward.
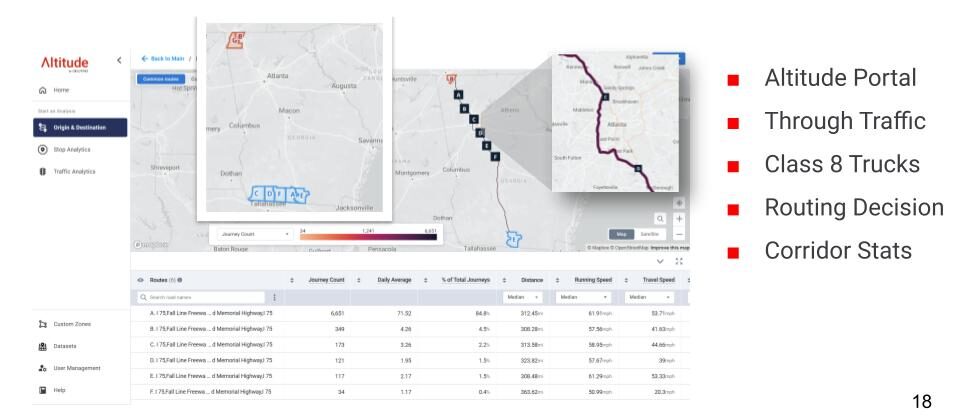
This insight suggests that mode-shifting those trips to rail may offer a more viable relief strategy than pushing freight toward Southeastern ports including Savannah or Charleston. This is the type of actionable intelligence planners need to craft realistic multimodal solutions.
When combined for deeper analysis, real-world transportation metrics do far more than support freight bottleneck detection. They guide investment strategy. The right data helps planners:
Validated freight analytics don’t just document infrastructure challenges; they empower you to design targeted, results-focused solutions for your region. The Altitude platform gives you the clarity you need to see risks early, respond quickly and keep freight moving efficiently across the nation.
See how your state’s congestion priorities compare to the rest of the nation. We analyzed 50 state freight plans to uncover the top three challenges facing planners today: safety, infrastructure decay and congestion. Download the full eBook to see the data behind these trends and discover how validated analytics can help you design targeted, results-focused solutions for your region.
Four early-warning indicators can flag a developing bottleneck long before it appears on annual rankings: vehicle miles traveled (VMT) trends, speed degradation patterns, Origin & Destination (O/D) behavior and mode-shift opportunities. Tracking these together gives planners a defensible, proactive framework instead of waiting to react once congestion is already costly.
By the time a corridor makes an official ranking, the economic damage is already underway — higher fuel consumption, wasted labor hours, elevated inventory carrying costs and reduced supply chain reliability. Congestion can add a significant cost burden to freight movement, so identifying problems while they’re still emerging empowers agencies to act before they require expensive infrastructure projects.
VMT is one of the most critical indicators of corridor health. It helps planners pinpoint where traffic is outpacing infrastructure, providing early evidence to justify capacity upgrades or preservation projects. Because the data is corridor-specific, it can also directly support competitive funding applications, such as Trade Corridor Enhancement Program (TCEP) grants.
O/D analysis shows where freight travel actually begins and ends, revealing whether a corridor is serving through-traffic, which alternate routes could absorb demand, whether mode-shifting or port rebalancing is viable and which bottlenecks have the highest network-wide impact. These details help planners design more precise, targeted solutions rather than one-size-fits-all fixes.
Mode-shift data can reveal alternative relief strategies planners might otherwise miss. For example, an analysis of Florida’s I-75 corridor found that most long-haul freight bypasses Atlanta by routing westward — suggesting that shifting those trips to rail may be more effective than routing freight toward Southeastern ports like Savannah or Charleston. This kind of insight helps planners craft realistic, multimodal solutions grounded in actual traffic behavior.
Telematics data for freight planning complements traditional sources. Our checklists share what telematics data can and can’t do to support freight planning.
New data sources for MPO freight planning: 3 overlooked metrics that reveal regional trends before they hit your dashboard.
State DOTs can forecast truck traffic earlier by watching freight metrics from city and port data. Here are 3 signals worth tracking.