New data sources for MPO freight planning
New data sources for MPO freight planning: 3 overlooked metrics that reveal regional trends before they hit your dashboard.
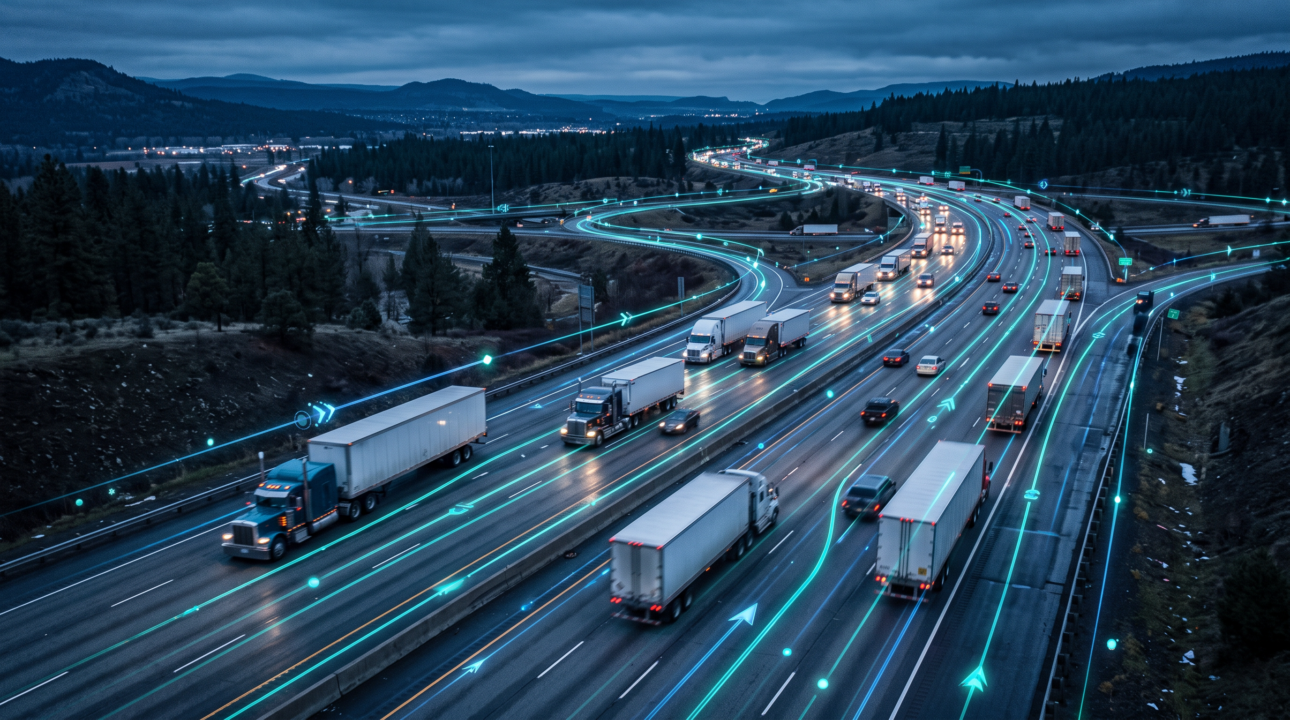
If you’re unfamiliar with how to use telematics data for freight planning, it can be confusing or easy to dismiss. Or it can sound like a magic solution to answer every transportation question that totally replaces cameras, WIM stations and tube counters. But the truth is somewhere in between.
Telematics data complements traditional transportation data sources. It fills in gaps, reveals details and shows the motion of travel in ways that counters can’t. Our checklists share what telematics data can and can’t do to support freight planning.
Telematics data consists of anonymized, aggregated commercial vehicle GPS movements captured by a device hardwired to the vehicle – also sometimes called “probe” data. Vehicle telematics captures billions of trips across North America in the past right up to near real-time.
Key top-level differences are that cameras and counters offer a fixed point measurement, while telematics is a moving trajectory. Also, mobile device or app-based data is extrapolated and modeled, and sample sizes don’t always match up to heavy freight activity areas. Telematics data is expanded from actual observed truck movements and isolated to commercial traffic only.
✅ Identify real-world freight corridors and route preferences, revealing which roads trucks actually use, not modeled assumptions.
✅ Show true origin-to-destination flow via chained trip analysis, which links sequential stops to show how freight moves between zones or through gated points (like bridges).
✅ Expand coverage between and beyond fixed count sites, offering visibility across all corridors and anywhere telematics-equipped trucks drive.
✅ Classify vehicles by type (heavy-duty, medium-duty, light-duty) and vocation, or what that truck’s “job” is; for example, long-haul, regional, hub-and-spoke or door-to-door deliveries.
✅ Reveal high-risk roadway segments by identifying where crash hazard, traffic pattern and volume data intersect. For example, The Texas A&M Transportation Institute used Altitude’s aggregated truck telematics to flag high-risk segments on U.S. highways.
✅ Show near-real-time freight trend shifts (e.g., daily/weekly volume changes) faster than most camera/count programs report out. For example, Altitude’s Tariff Trend Tracker shared U.S.–Canada commercial freight data from major bridge crossings and ports in response to tariff changes.
✅ Capture regional/multi-county freight activity patterns at a fraction of the cost and lead time of installing new count infrastructure.
✖ A certified, audit-grade point count. Probe data is a statistical estimate, not a direct physical measurement. Cameras/WIM stations remain the gold standard for exact axle counts, vehicle classification, and weight at a specific location and point in time.
✖ Payload data. Commodity type/value requires pairing with commodity flow data. Example: Rhode Island’s state freight plan combined Altitude’s telematics data with S&P Global’s commodity flow database — neither alone was sufficient.
✖ Full population counts. Raw observed GPS trips undercount total truck traffic and need a scaling methodology, ideally calibrated against known camera/WIM counts at overlapping locations.
✖ Driver details. Probe data is anonymized and aggregated by design; it’s a planning tool, not a tracking or compliance tool.
✖ New corridor data. Sparse historical data limits confidence in emerging or underused routes; a temporary camera/tube count may still be the faster information source.
For freight planning workflows, telematics data vs traditional data sources actually isn’t an either/or choice because the two work together.
| Freight planning question | Telematics data | Traditional freight data | Best approach |
|---|---|---|---|
| Where do trucks actually travel? | Shows real-world truck routes, corridor use and route preferences across a broad network. | Fixed counters show truck activity only at monitored locations. | Use telematics for network-wide coverage; use counters to validate specific locations. |
| How much truck traffic moves through a corridor? | Provides observed truck movements that can be expanded to estimate total freight activity. | Cameras, tubes and WIM stations provide direct counts at specific points. | Telematics that are calibrated to known counts can provide freight activity data. |
| What is the exact truck count at one location? | Provides a statistical estimate based on observed probe movements. | Cameras and tube counters directly measure vehicles at a fixed point. | Use traditional counts as the source of record; use telematics for context and coverage. |
| What are the exact axle counts, vehicle classes or weights? | Can classify vehicles by broad type and vocation, but does not directly measure axles or weight. | WIM stations and cameras provide physical measurements of vehicle and axle characteristics. | Use WIM/cameras for precise classification and weight data. |
| What are the origins and destinations of freight trips? | Chained trip analysis can connect sequential stops and reveal origin-to-destination flows. | Traditional point counts do not show complete trip paths. | Use telematics to understand freight flows between zones and facilities. |
| Which truck types use a corridor? | Can classify commercial vehicles by type, such as heavy-duty, and by vocation. | Counters can classify vehicles at individual monitored locations. | Use telematics for broader network patterns; validate classifications at fixed sites. |
| What kind of freight is being transported? | Does not identify commodity type or cargo value on its own. | Commodity flow databases provide information about freight commodities and flows. | Pair telematics with commodity flow data to understand what is being moved. |
| Where are freight activity gaps in the network? | Extends visibility between and beyond fixed count locations where equipped trucks travel. | Coverage depends on where physical sensors have been installed. | Use telematics as a coverage layer to identify gaps and prioritize new counts. |
| Where are high-risk freight roadway segments? | Can reveal harsh braking, acceleration and cornering data that can be combined with crash and roadway data. | Crash and roadway data provide complementary safety information. | Combine telematics with safety and roadway datasets to identify risk. |
| How quickly are freight patterns changing? | Can show current commercial freight activity or activity across date ranges. | Camera and count programs may have longer reporting cycles. | Use telematics to monitor emerging trends, then validate important changes with fixed counts. |
| Can telematics provide a complete truck population count? | No. Observed probe trips represent a sample and require an appropriate expansion methodology. | Physical counts provide direct observations at specific locations. | Calibrate telematics against known counts before estimating total truck volumes. |
| Can telematics track individual drivers or trucks? | No. Aggregated telematics data is designed for planning rather than individual tracking. | Traditional planning datasets also generally do not provide individual trip histories. | Use aggregated data for network planning, not driver-level monitoring. |
| What is the best data source for a new or emerging corridor? | May have limited historical coverage if truck activity is sparse or the corridor is new. | Temporary cameras or tube counts can provide direct measurements at a selected site. | Use targeted counts when immediate, location-specific ground truth is needed. |
Cameras and WIM stations act as a calibration layer because they capture the known, physically-measured points that validate a telematics expansion factor. Telematics then becomes the coverage layer, capturing details and extending that ground truth across the rest of the network where no fixed sensors exist or mobile app coverage is sparse.
If your question is “where and how much” freight moves across a corridor then telematics is strong. If your question is “exact axle counts or vehicle classification at one location” then keep the camera/WIM station as the source of record, and use telematics to fill in everywhere else.
Learn more about how agencies use vehicle telematics for freight planning. Get our case study for more details about how Altitude’s telematics data supported Rhode Island’s state freight planning.
No. Telematics data complement traditional freight data rather than replace it. Cameras and WIM stations provide the ground-truth measurements needed for exact vehicle counts, classification, axle counts and weight at a specific location. Telematics extends that ground truth across the broader network.
Telematics show how freight actually moves across a network, including real-world truck routes, origin-to-destination flows, vehicle types and vocation patterns. It can also provide broader coverage between count locations and reveal changes in freight activity over time.
Telematics data are statistical estimates based on observed commercial vehicle movements, so they do not represent a complete count of every truck. Planners should use known camera or WIM counts to calibrate expansion factors, then use telematics to estimate activity across locations without fixed sensors.
Use both based on the question you need to answer. Telematics is particularly useful for understanding where and how much freight moves across a corridor or network, while cameras and WIM stations remain the source of record for exact point-level counts, vehicle classification and weight. Combining the two provides both coverage and measurement accuracy.
New data sources for MPO freight planning: 3 overlooked metrics that reveal regional trends before they hit your dashboard.
State DOTs can forecast truck traffic earlier by watching freight metrics from city and port data. Here are 3 signals worth tracking.
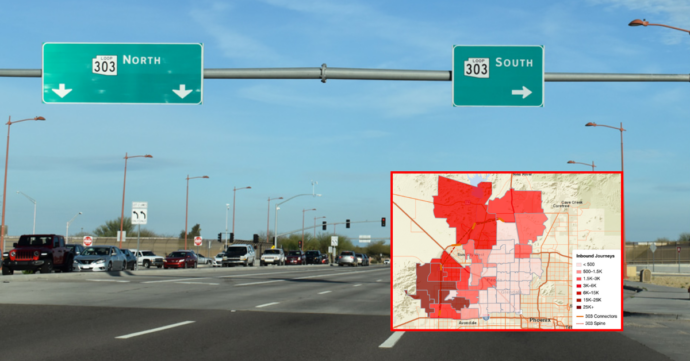
How warehouse cluster growth is changing truck traffic near Phoenix’s Loop 303 — freight O-D data on leakage, exit ramp load and vocation mix shifts.