Truck traffic volume changes may not capture the true usage shift on freight corridors. An Origin-Destination analysis with vehicle vocation can reveal key details about the kinds of trucks, where they exit and where they go.
Adding industry insights confirmed usage shifts in Phoenix – a planned city bypass is being used, but by warehouse cluster traffic, not pass-through long-haul trucks.
New “gigafactory” industrial areas show completely different commercial travel behavior than long-haul truck traffic, requiring different planning and infrastructure support.
What happens to freight movements when warehouse clusters change how an existing corridor is used? And how can planners tell whether a highway is carrying through freight, serving local facilities or doing both?
Arizona’s Loop 303 was built to offer a smooth and fast bypass around downtown Phoenix. But our analysis finds that only about 6% of Class 7 and 8 trucks moving through the region actually use it that way. Most long-haul trucks still travel all the way downtown and up through I-17.
The 303 isn’t operating as a bypass, but it’s far from empty. The traffic on Loop 303 appears to be feeding a fast-growing local industrial economy instead of passing through. That shift matters for how planners think about the roads around it.
This analysis uses Altitude by Geotab’s observed, real-world commercial vehicle movement data. Unlike general traffic counts or modeled estimates, Altitude can show how vehicle class, vocation, trip length, origin-destination patterns and stop behavior vary across a corridor. That freight-specific context helps planners understand not only how much traffic is moving, but what kinds of commercial activity are shaping the network.
How warehouse clusters changed the plan for Loop 303
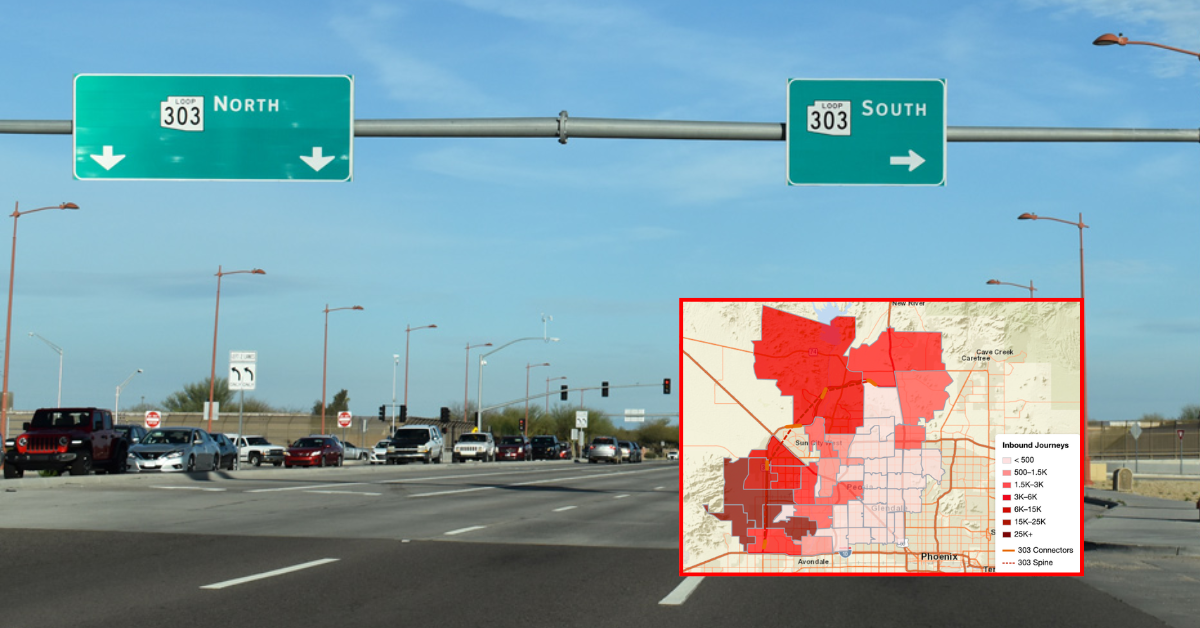
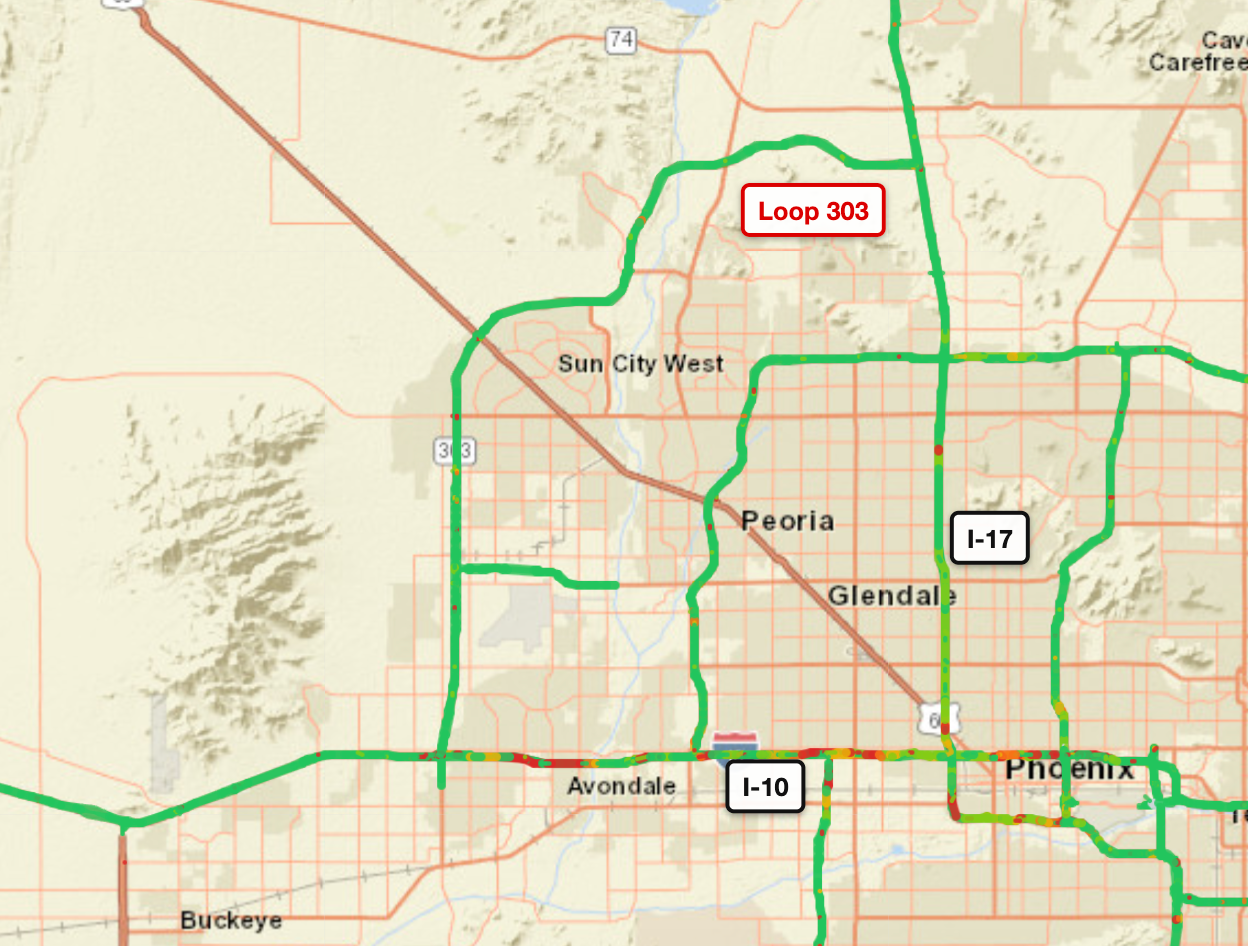
Loop 303 loops around the southwest side of Maricopa County, offering an alternative to the I-10/I-17 combination carrying most north-south freight through Phoenix. In recent years, the corridor started drawing large-scale development consisting of new manufacturing plants and distribution centers for large retailers.
Figure 1: The Loop 303 corridor was designed as a Phoenix city bypass.
When a mature corridor suddenly sprouts a wave of new industrial development, it’s worth looking at how road usage in the area may have changed.
The analysis is based on aggregated and anonymized insights. Individual drivers, vehicles and companies are not identified or exposed. This privacy-by-design approach allows planners to understand commercial movement patterns while protecting the operational information of the fleets contributing to the data ecosystem.
Tracking traffic off the highway
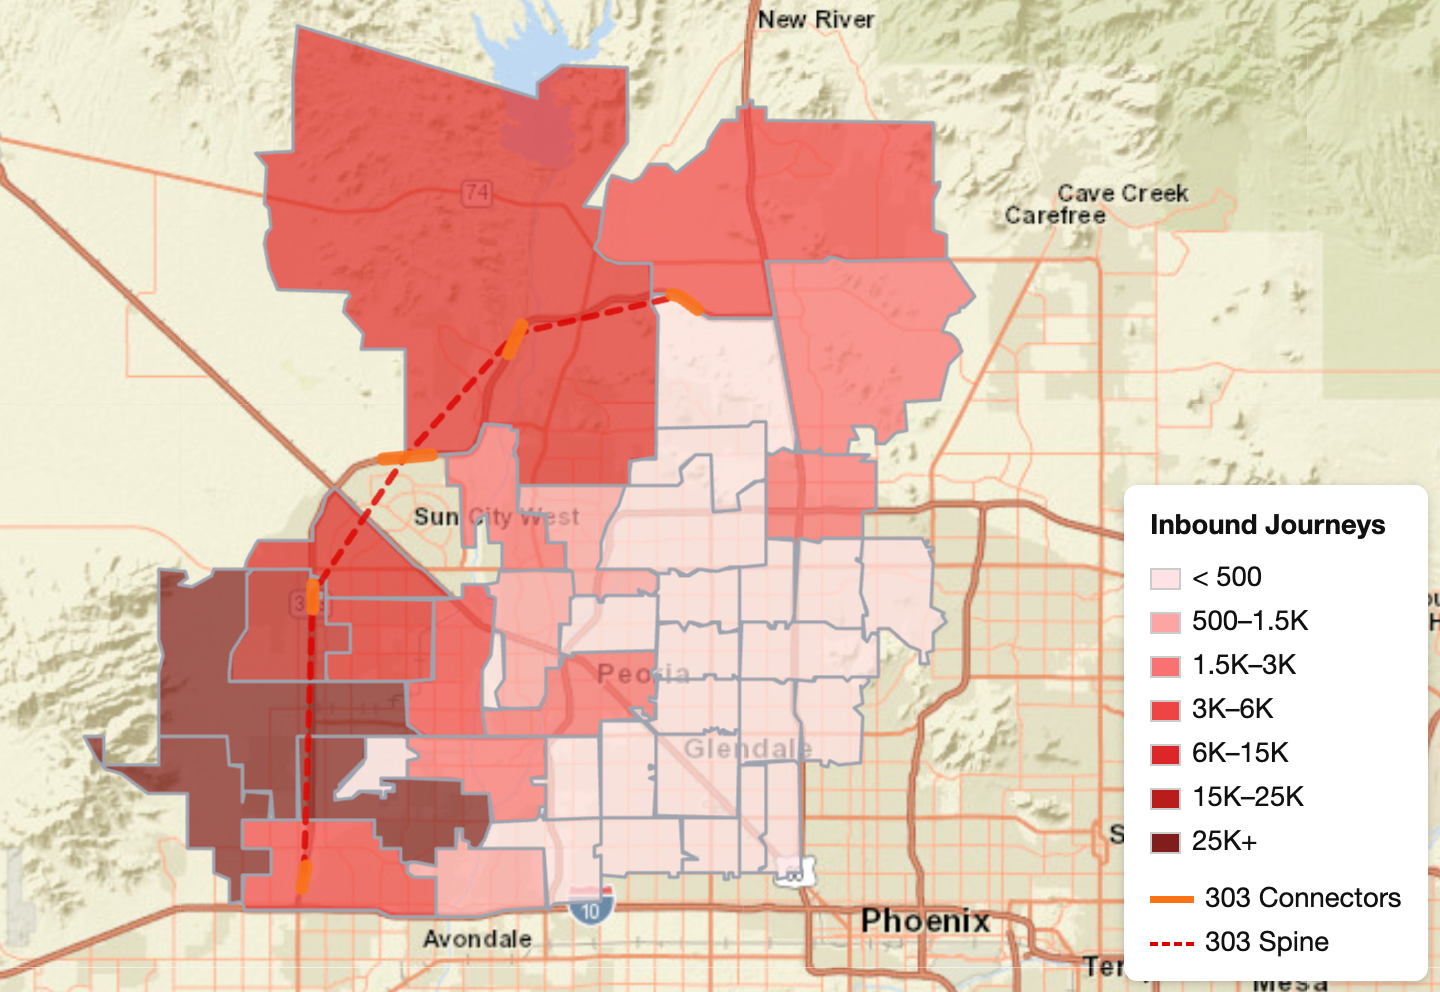
The most useful way to analyze freight change isn’t just measuring volume changes on the 303, it’s tracking where trucks exit and where they ultimately go. Origin-Destination analysis helps us follow truck journeys from the highway into the surrounding street network.
Figure 2: An Origin-Destination analysis reveals where trucks stop after exiting the Loop 303 corridor.
What shows up in our analysis is a clear pattern of “leakage,” (defined as highway-to-local spillover, where commercial vehicles exit the main corridor and continue onto surrounding local roads) from traffic exiting Loop 303 into nearby ZIP codes and local roads. That matters because an 18-wheeler exiting onto a road built for neighborhood traffic needs different support than a passenger car taking the same exit. Trucks are harder to maneuver, put more load on intersections and add wear and tear to pavement that wasn’t engineered with that weight in mind.
Every exit on Loop 303 reflects a planning decision made a long time ago, and now being tested by traffic patterns nobody could have predicted when the road was built.
Two ZIP codes, two different impacts
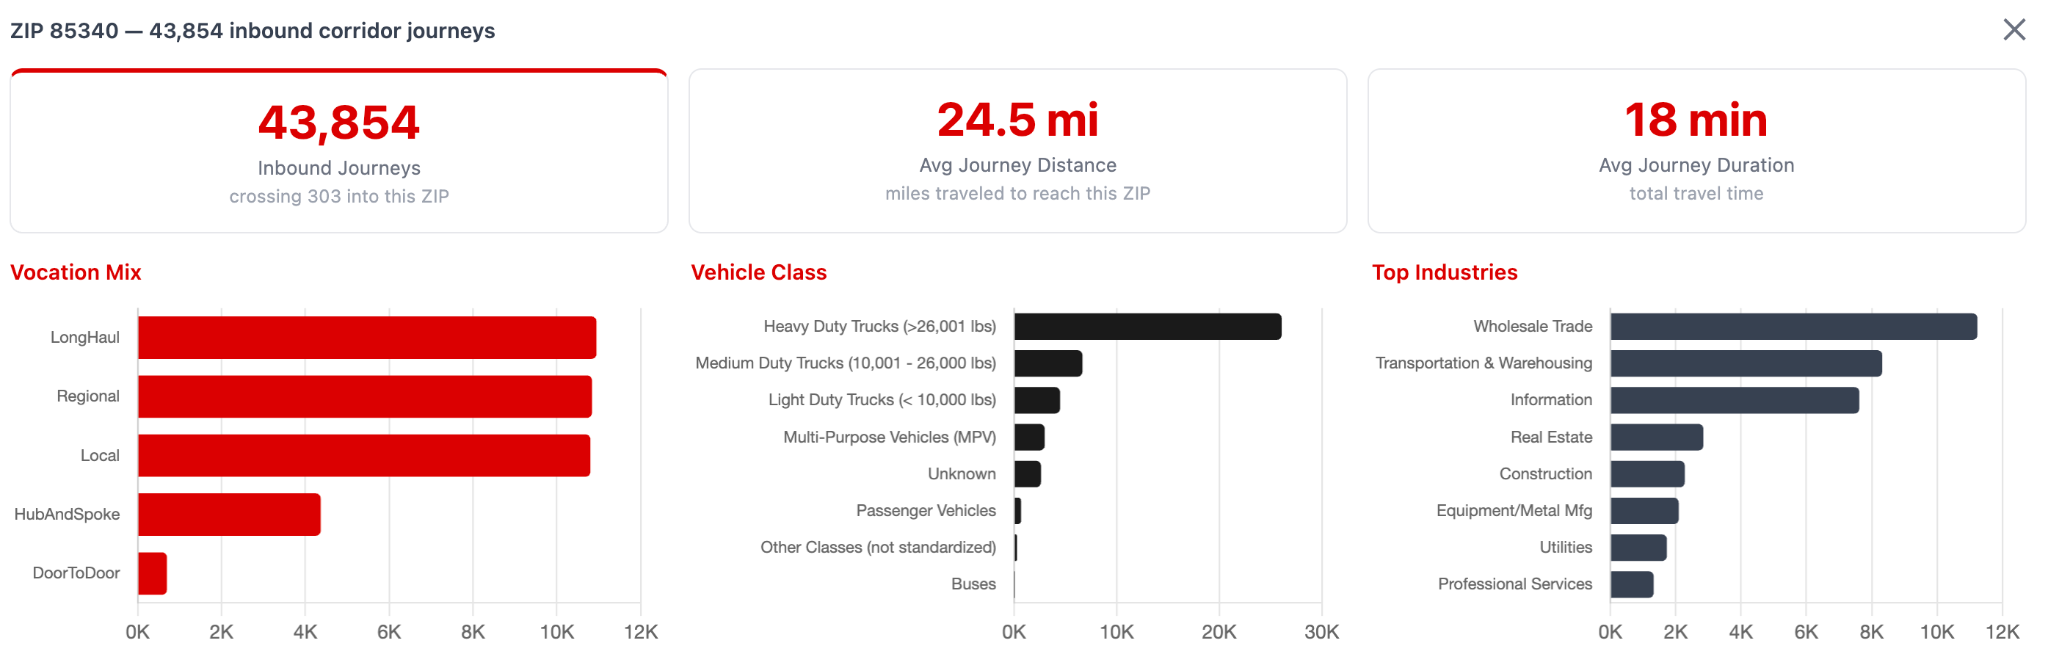
If we drill down to one ZIP code near the industrial core, the traffic mix tells a clear story. We see mostly heavy-duty trucks, a lot of long-haul trips, average journeys around 24 miles, and industries dominated by wholesale trade and warehousing. This is what you might expect next to a cluster of distribution centers — goods coming in from across the country and heading back out again.
Figure 3: A closer look at vehicle vocation, type and trip lengths for truck traffic in one Loop 303 destination area.
When we move a few miles closer to the inner city, the picture flips. Light-duty trucks and multipurpose vehicles take over. Trips get shorter and more local. The dominant industries shift to construction, utilities and food manufacturing — door-to-door and hub-and-spoke deliveries rather than long-haul freight.
This is one corridor, but it’s generating at least two distinct traffic types depending on which off-ramp we study. A one-size-fits-all read of “Loop 303 traffic” would miss both of them.
New networked traffic impacts
It’s tempting to think of local freight movement as a simple hub-and-spoke system: Goods arrive at a distribution center, then fan out to stores and customers. But the traffic along Loop 303 points toward a more networked story.
Our analysis suggests that factories and warehouses in this corridor aren’t just shipping outward, they may be trading with each other. A factory may be sending materials to a nearby supplier, which feeds a neighboring plant, which feeds another facility down the road.
This possibility aligns with the gigafactory trend in industrial development, where companies cluster resources and suppliers as close together as possible to shrink their supply chains. In that model, a truck moving between two facilities a mile apart still counts as Class 7/8 freight activity, even though it never touches a highway on-ramp headed out of state. That’s a different kind of “local” traffic than planners have traditionally modeled for.
Transportation planning indicators to watch
Getting a clean read on commercial travel time reliability (without passenger vehicles blended in) shows planners where freight bottlenecks actually form and when, with PM peak periods consistently standing out as the toughest. That’s the kind of detail that should drive where economic-focused mitigation dollars go, especially when a meaningful share of roadway miles is falling short of reliability targets.
Because Loop 303 is a mature corridor, it also offers a rare chance to measure real-world performance against the original plan. That comparison gives a valuable preview of how to prepare other corridors for similar growth, or how to respond when it happens.
A few signals worth building into your own planning process:
Leakage ZIP codes — where is highway traffic consistently spilling into local streets, and is that volume growing?
Exit ramp load — are specific off-ramps absorbing new truck volume that wasn’t part of their original design intent?
Vocation mix shifts — changes in the balance of long-haul, regional and local trips can be an early signal that the local economy around a corridor is changing shape.
Freight data isn’t just a highway story anymore. Corridors like Loop 303 show that it’s increasingly a lens into how a region’s economy is physically organizing itself, one off-ramp at a time.
Interested in seeing this type of analysis for your region? Contact us for a personalized demo.
Frequently Asked Questions
Origin-Destination analysis combined with vehicle vocation can reveal where trucks exit the highway, where they ultimately travel, and what activity they serve. This helps distinguish long-haul pass-through freight from regional and local trips for nearby warehouses, manufacturers and suppliers.
As industrial development expands, truck traffic can “leak” from the highway onto local streets and concentrate around specific exits. Transportation planners can use destination ZIP codes, exit-ramp volumes, vehicle types and trip lengths to identify where infrastructure may be experiencing unplanned freight impacts.
Industrial clusters can create a mix of long-haul, regional and short local freight trips. Areas near distribution centers may see heavy-duty long-haul trucks, while nearby industrial zones can generate more light-duty and multipurpose vehicle trips for construction, utilities, deliveries and facility-to-facility movements.
Key indicators include highway-to-local “leakage” ZIP codes, exit-ramp truck volumes, vehicle vocation mix, trip lengths and commercial travel-time reliability. Tracking these measures over time can reveal when freight patterns are diverging from the corridor’s original design assumptions and where targeted infrastructure improvements may be needed.
The Tennessee Department of Transportation has chosen Altitude by Geotab for a four-year subscription contract through The Eastern Transportation Coalition. TDOT will access Altitude’s comprehensive transportation analytics suite to support planning and performance measurement.
Discover what truck parking data is available for transportation agencies, from journey thresholds to peak demand hours, to prioritize corridors and strengthen funding requests.
See the 3 commercial vehicle datasets transportation planners use most — harsh events, speed analysis, and origin-destination data — with real examples.