

A planner’s checklist: What telematics data can (and can’t) do for freight planning
Telematics data for freight planning complements traditional sources. Our checklists share what telematics data can and can’t do to support freight planning.

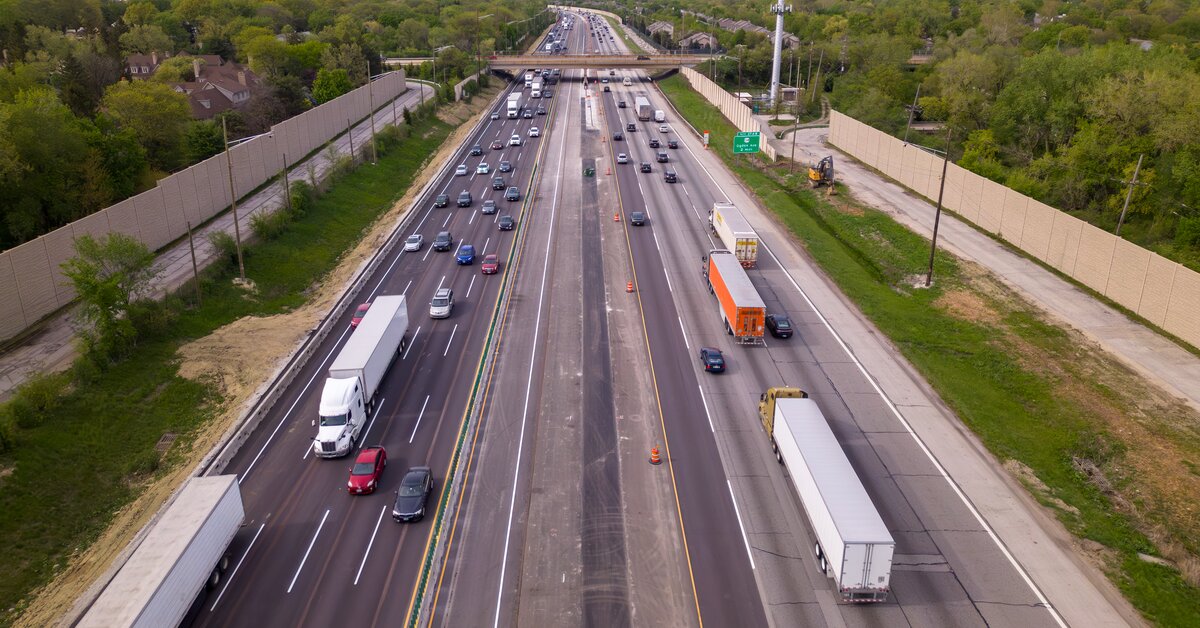
Planners widely accept federal Annual Average Daily Traffic (AADT) data because it’s defensible and universally recognized. But when the project is specifically about truck and freight infrastructure, it’s time for more detail.
First-party commercial vehicle data separates guessing from knowing. Even better — getting current-year freight corridor AADT within 90 days of year end. Here we examine five use cases where Altitude AADT supports federal data to deliver same-year granular commercial vehicle insights that change transportation outcomes.
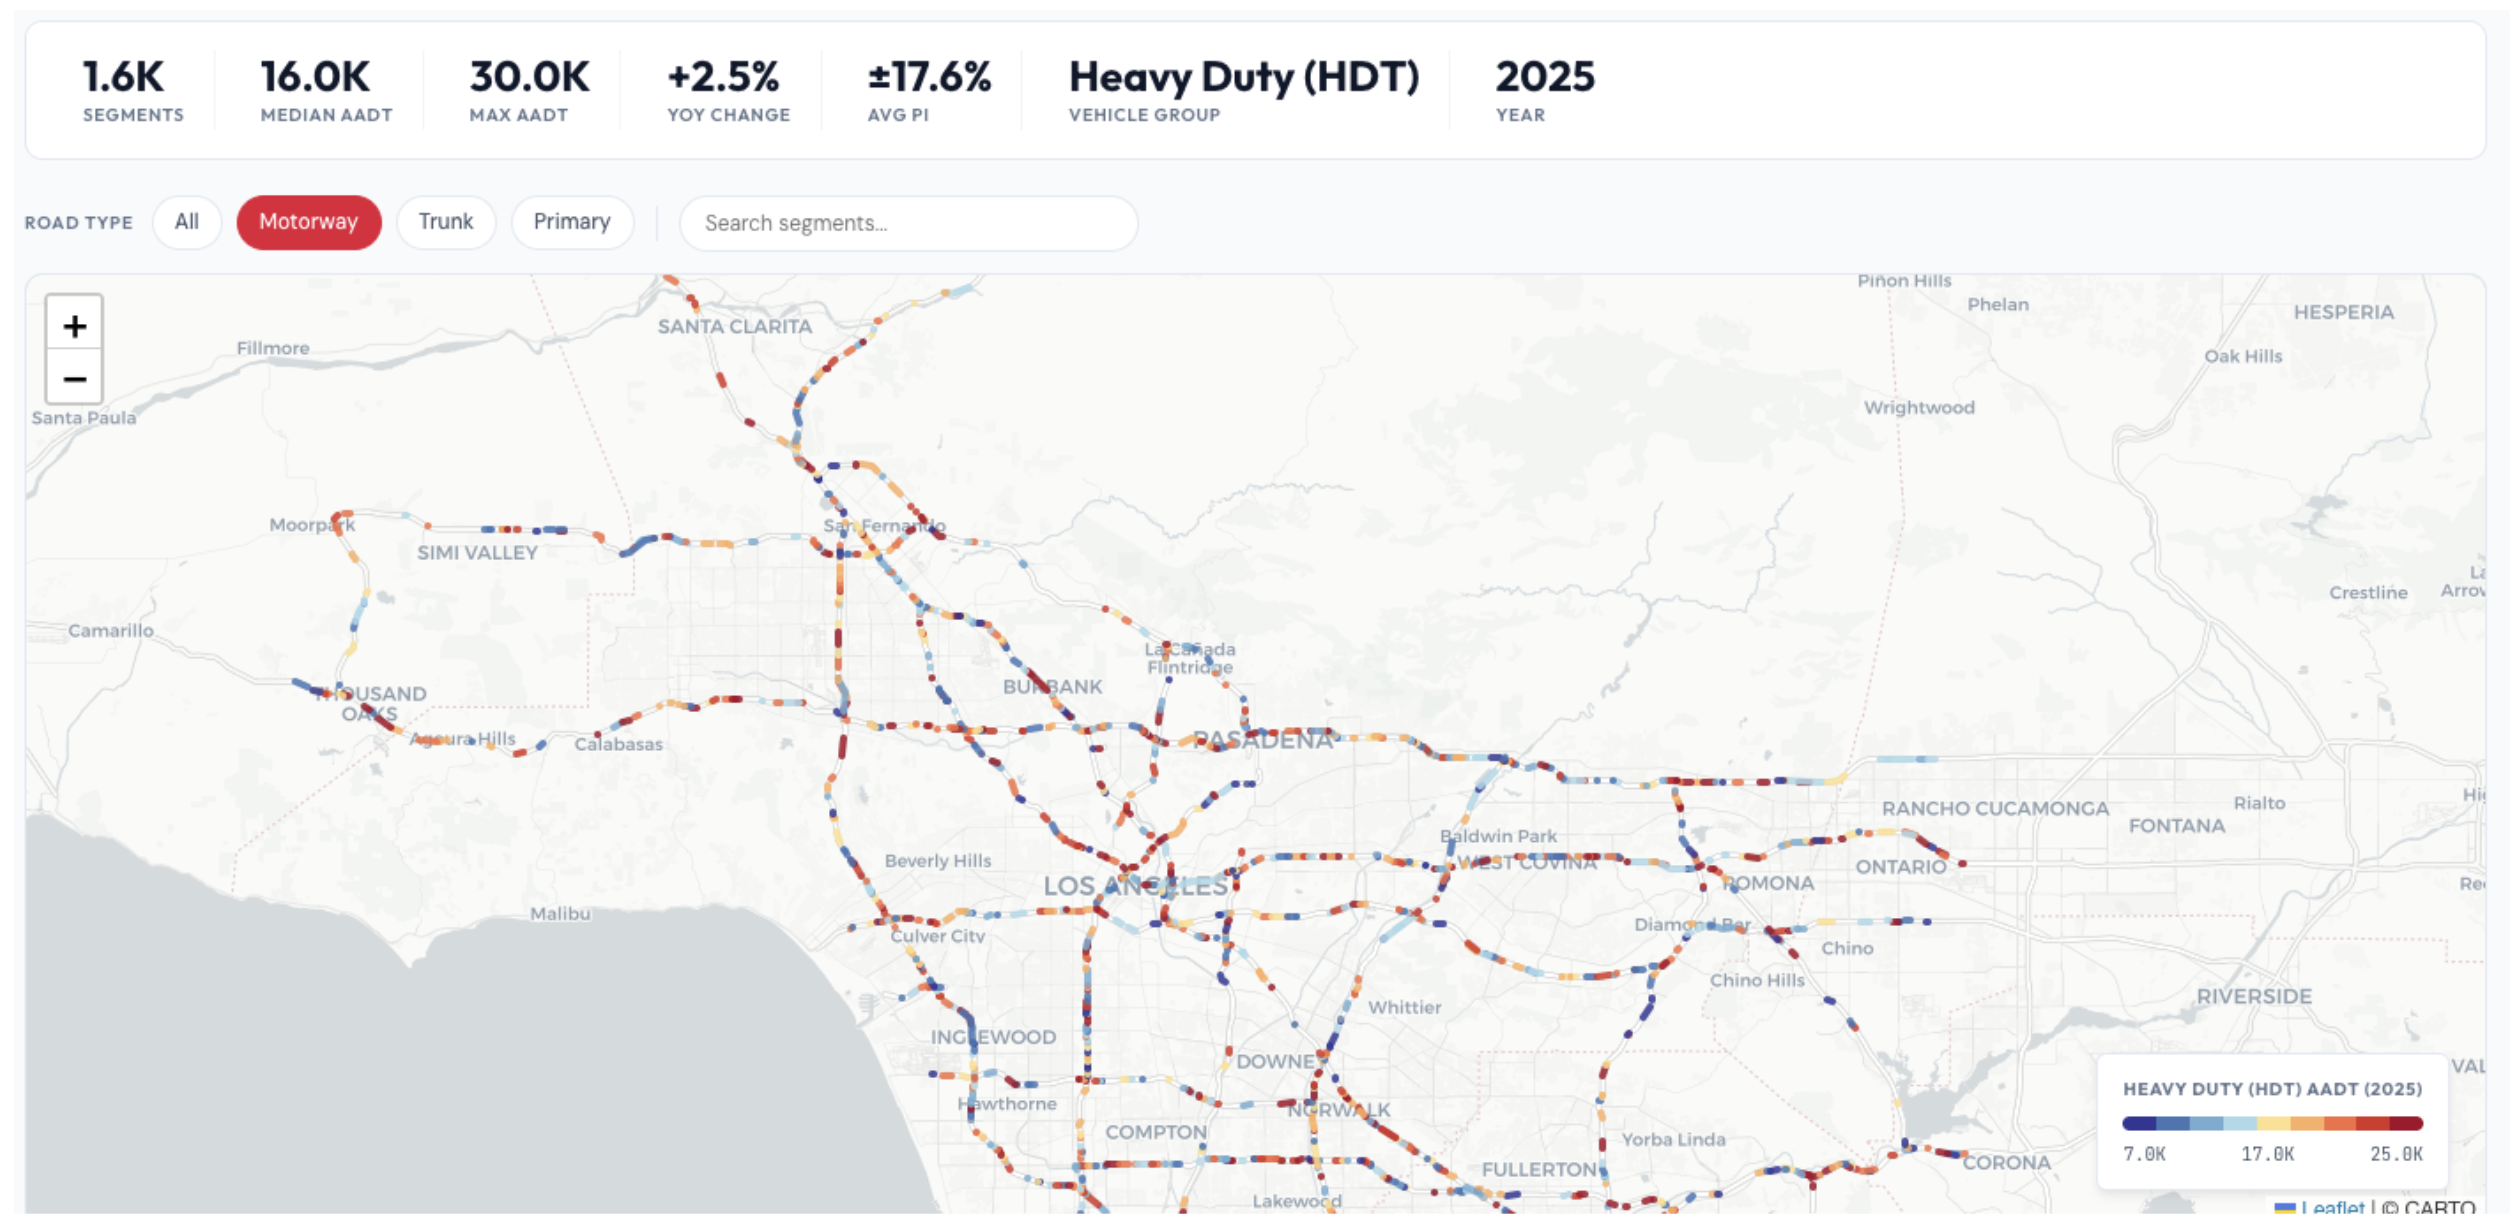
Federal Highway Administration (FHWA)-derived AADT relies on camera-based counts placed on major interstates and highways. That means federal cameras often miss or get poor samples on secondary corridors, port connectors, last-mile arterials and industrial access roads. Altitude’s commercial-vehicle data covers segments down to roughly 500 meters of roadway, including roads that have no permanent counters at all.
Why it matters: A planner designing a port-to-rail freight corridor needs reliable truck volumes on a county road connecting a marine terminal to an inland intermodal facility. No FHWA camera exists on that stretch. Altitude’s telematics-based counts fill the gap and give the project team defensible data for their pavement design recommendations.
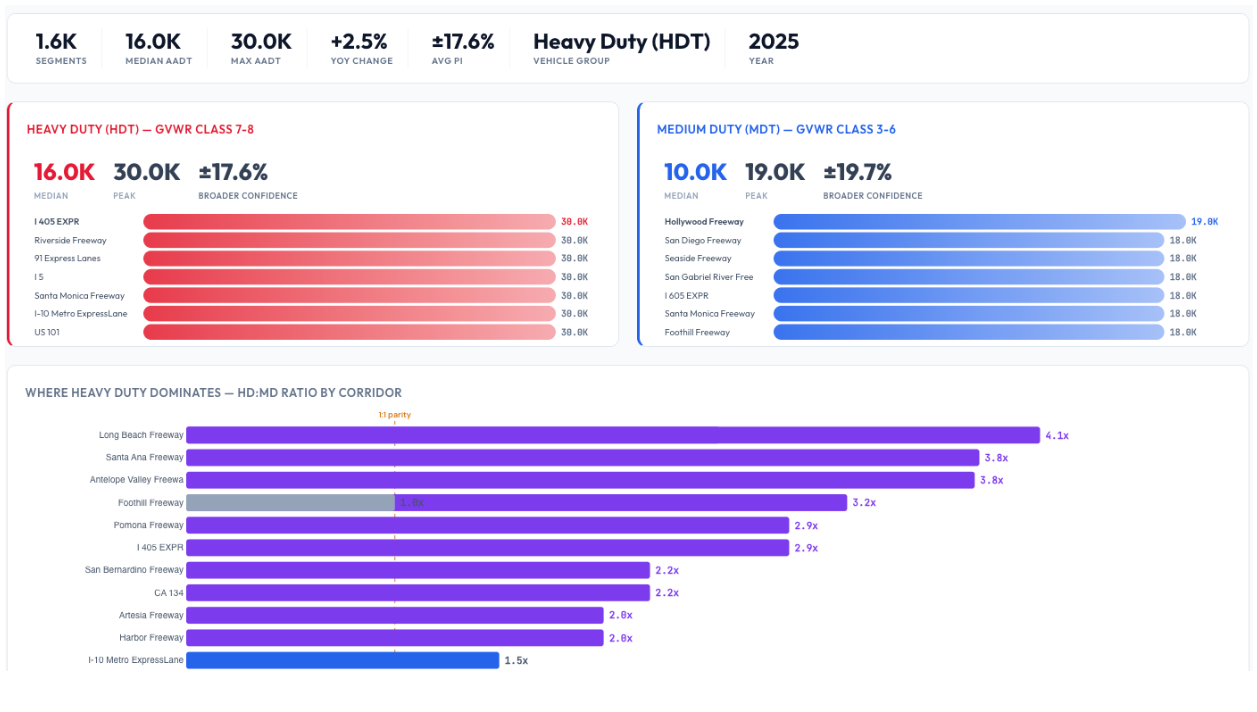
General AADT tells you how many vehicles use a road. It doesn’t tell you how many of those are 80,000-lb Class 8 trucks. For freight infrastructure work, that distinction matters enormously for pavement thickness choices, turning radius design, bridge load ratings and drainage. These examples and more depend on weight class distribution, not just volume.
Why it matters: A state Department of Transportation engineering team is evaluating whether to resurface a freight corridor with standard asphalt or a heavier-duty concrete mix. Altitude’s heavy-duty truck AADT shows that 70% of truck volume on that corridor is Class 7–8. The more specific finding justifies the more expensive material and helps protect the agency in a future audit.
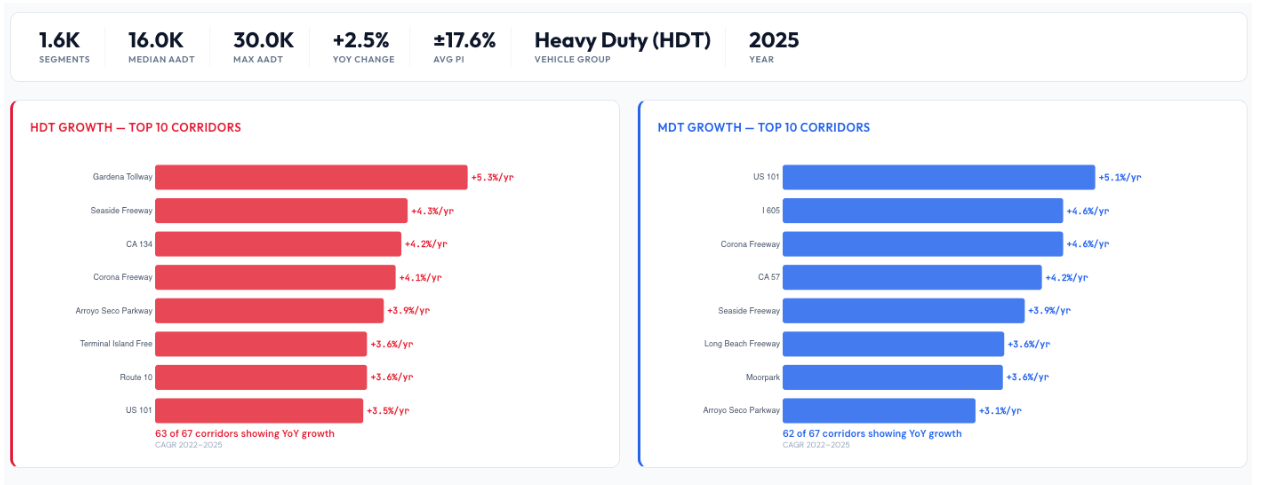
The standard lag for validated federal AADT is one to two years. Altitude delivers previous-year estimates within 90 days of year-end. For planners working on federal reporting cycles or grant applications, submitting data that reflects last year rather than three years ago is a meaningful competitive advantage.
Why it matters: A Metropolitan Planning Organization preparing its long-range transportation plan update needs current freight volume data to support a grant application. With Altitude, they can submit using data from the prior calendar year rather than relying on counts that predate a major warehouse development that changed truck patterns on the corridor.
One of the reasons planners default to federal AADT is that it’s widely accepted, so you can cite it without having to defend it. Altitude’s traffic-volume binning provides explicit confidence intervals and uses FHWA-aligned validation methods, giving consultants something they can actually explain and defend in front of a review panel or grant committee.
Why it matters: An engineering firm submits a corridor safety study that includes Altitude AADT counts for a non-Interstate freight route. When the state review board asks how the numbers were derived, the consultant can walk through the Expansion Factor methodology and confidence range rather than saying, “We estimated based on the nearest counter 12 miles away.”
Planners don’t need to abandon federal AADT to use Altitude. In fact, using both is the strongest approach. Altitude’s commercial telematics data can confirm federal counts on corridors where both exist, and stand in as the primary source where federal counts are absent or stale.
Why it matters: A freight planning consultant is building a truck parking demand study across a multi-state corridor. On major interstates, they cross-reference Altitude heavy-duty truck counts against FHWA data to validate their assumptions. On secondary state routes that connect to truck stops, Altitude is the only reliable source, and it shows meaningfully different volumes than what planners had assumed.
Transportation planners and engineering consultants are increasingly expected to produce freight plans that hold up under scrutiny from federal reviewers, state DOTs and the public. General AADT was never designed for that job. Altitude’s class-specific, 90-day AADT gives planners the granularity, timeliness and transparency that freight infrastructure decisions actually require.
Access up-to-date, reliable and defensible AADT while it is still relevant to your planning cycle.
Telematics-based data like Altitude AADT covers road segments down to roughly 500 meters, including secondary corridors, port connectors, and industrial access roads that FHWA cameras never reach. So if you’re working on a county road connecting a marine terminal to an intermodal facility, you can still get defensible truck counts for pavement design — no permanent counter required.
General AADT gives you total vehicle counts — cars, trucks, everything blended together. Freight corridor AADT breaks that down by vehicle class, so you can see specifically how many heavy-duty Class 8 trucks use a road versus medium-duty vehicles. That distinction drives real engineering decisions like pavement thickness, bridge load ratings, and turning radius design.
Altitude AADT delivers current-year freight corridor data within 90 days of year end, which is significantly faster than traditional federal count cycles. That matters when you’re making infrastructure or funding decisions that need to reflect what’s happening on roads now, not two or three years ago.
Telematics data for freight planning complements traditional sources. Our checklists share what telematics data can and can’t do to support freight planning.
New data sources for MPO freight planning: 3 overlooked metrics that reveal regional trends before they hit your dashboard.
State DOTs can forecast truck traffic earlier by watching freight metrics from city and port data. Here are 3 signals worth tracking.