A planner’s checklist: What telematics data can (and can’t) do for freight planning
Telematics data for freight planning complements traditional sources. Our checklists share what telematics data can and can’t do to support freight planning.

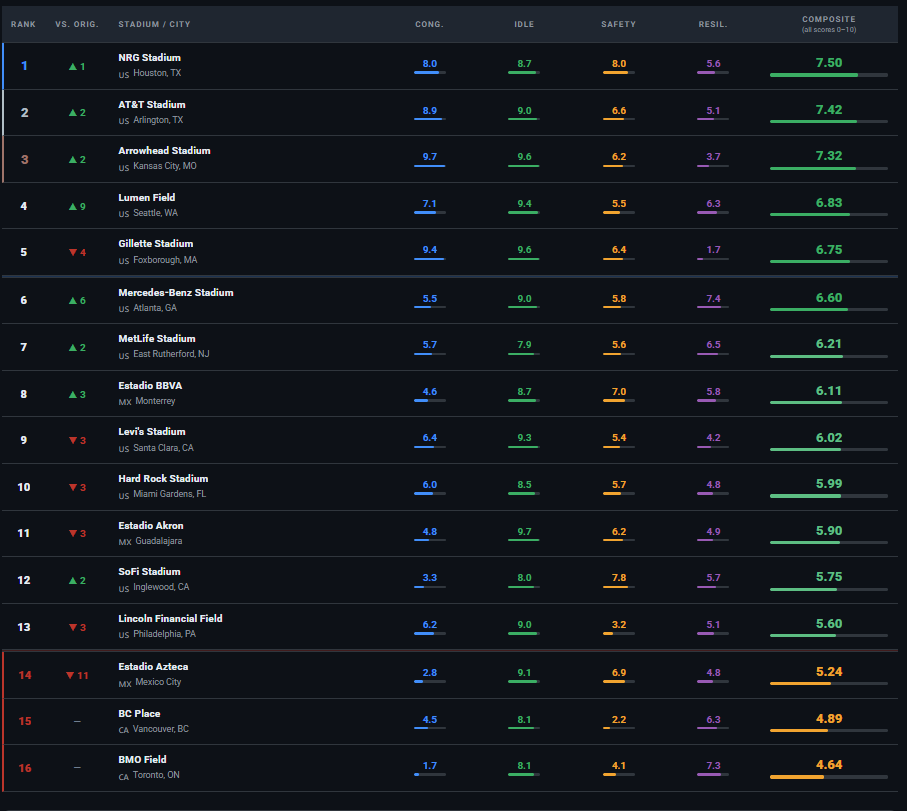
The tournament is over and the city results are in: NRG Stadium in Houston had the most efficient event traffic management of all 104 soccer matches in 16 cities during the 2026 games. During the playoffs, traffic flow in Houston scored highest on four different factors as measured by our composite efficiency score. Gillette Stadium outside Boston had the best baseline scores, but fell to fifth place in the final rankings.
With a rare weekday-heavy event lineup, the soccer tournament gives us an opportunity to measure and identify a big event’s impact on prime-time commercial traffic. Our analysis delves into more than just worsening congestion, and offers insights to improve traffic optimization.
Altitude’s efficiency score weighed congestion, resilience, safety and idle time. Combined, these factors affect commercial travel in a more nuanced way than assuming that more cars means worse traffic.
For example, let’s consider a truck moving through traffic that’s averaging 25% below the speed limit. The truck is likely in congestion, but if it’s holding a consistent speed it operates much more efficiently than if it’s continually braking or stopping and idling. Or consider a city that has low baseline congestion but its traffic flow gets hopelessly snarled for the rest of the day after an event, compared to a city that’s back to normal in an hour.
Our score captures those subtleties. We weighted the final scores so that a strong resilience score could offset a low congestion score — for example, a city where freight networks bounce back quickly from events may rank higher than one with less congestion but poorer adaptability.
Using aggregate commercial vehicle movement data, we measured the following components within two distances of each of the 16 stadiums: five km (60% weight) and 20 km (40% weight) and combined those for a blended score.
Why it matters: For commercial traffic, predictability matters just as much as speed.
Why it matters: Cities where traffic barely changed — or returned to normal quickly — score higher because traffic is minimally affected.
Why it matters: Braking and other harsh events raise driver risk. They are also markers of inefficient driving.
Why it matters: Less idling means more efficient freight movement and less wasted fuel.
Before the tournament started, our baseline measurements predicted that Gillette Stadium in Foxboro, Massachusetts would be the best at handling the coming events. As a suburban stadium, Gillette naturally has lower baseline congestion than a dense urban one. And if we measured congestion alone, Foxboro would have scored highly in our final ranking.
But additional traffic factors revealed some weaknesses in Foxboro and unexpected strengths at other stadiums.
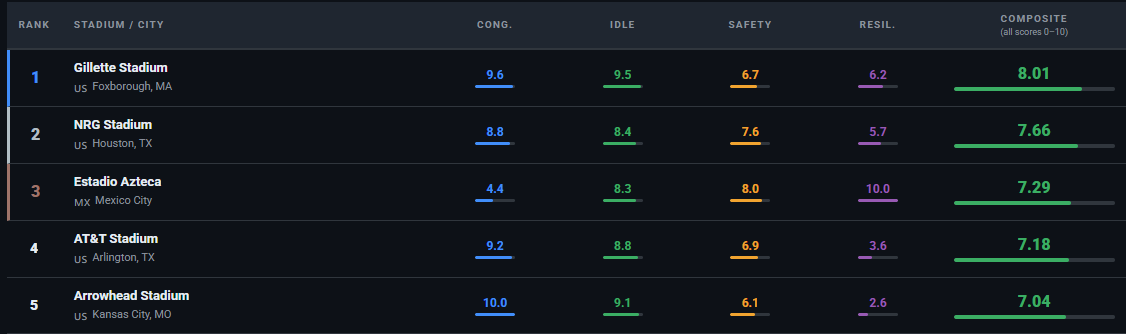
The final top-five rankings reflect a more nuanced measure than congestion alone. It turned out that other cities were more efficient at recovering from event traffic clogs. They also appear to keep congested traffic moving, as evidenced by better idling and safety scores than Foxboro. So although the area around Gillette stadium has remarkably low congestion, when congestion does hit it has an outsized affect on travel.
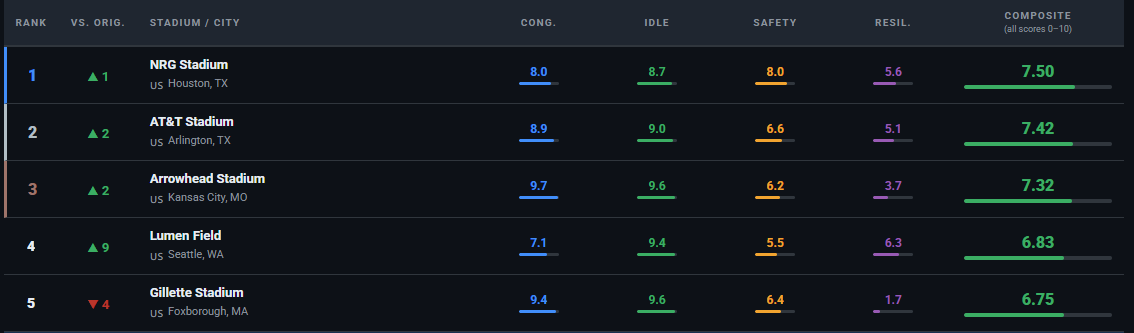
Houston has more congestion than Foxboro, but the other three factors score better for a higher overall score. That means Houston’s traffic flow is more predictable than Foxboro’s. A truck stuck in Houston before or after an event at NRG stadium knows it will likely keep moving and conditions will improve quickly.
Houston’s rise over Foxboro wasn’t an outlier. We saw many stadiums shift from their baseline predictions once actual traffic data replaced our pre-tournament estimates. Lumen Field in Seattle shot up by nine positions to fourth overall, and Atlanta’s stadium rose by six.
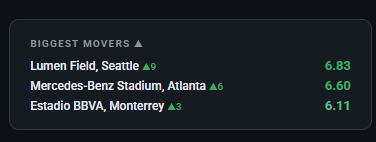
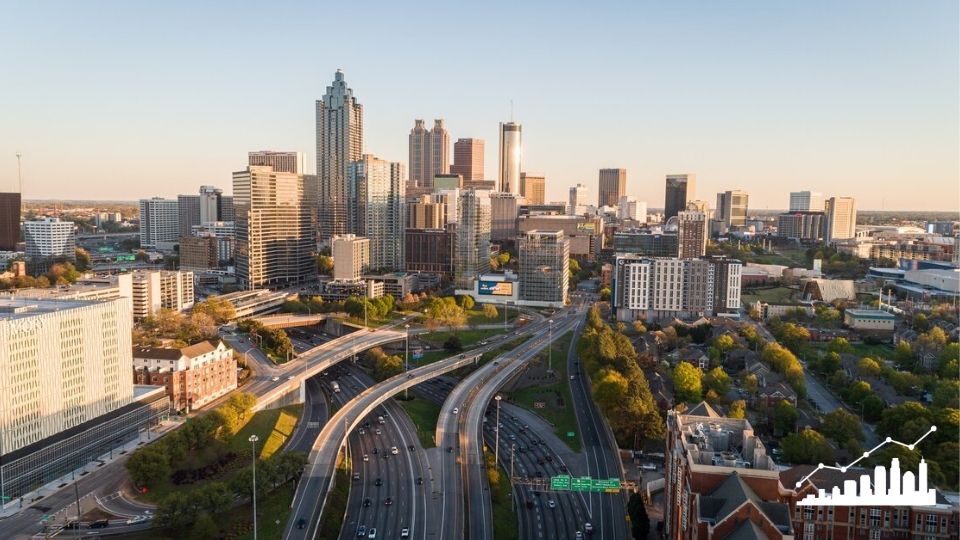
Similarly to Houston, Seattle and Atlanta’s stadium areas didn’t rank well for congestion — these are busy roads. But their trucks keep moving, without slamming on the brakes. Both areas also recover quickly by successfully returning to baseline activity soon after the event finishes.
Top cities are seeing the effect of good planning in action. It’s not just about measuring congestion and adding lanes. Successful event preparation is about evaluating and balancing multiple factors, then acting on them.
For example, publicizing alternate routes can shift traffic during events and help an area recover more quickly. Lowering posted speed limits during events can encourage steady traffic flow versus starts, stops and idling. When fleets are aware of big events ahead of time, they can adjust business and delivery schedules to avoid the pre- and post-event periods during which traffic is the most affected.
Looking to enhance freight efficiency in your region? Get our Freight Efficiency Report which analyzes nine U.S. cities to reveal which ones are leading the way in urban freight efficiency, which ones are falling behind and why.
Effective event traffic management should weigh four factors together: congestion (how smoothly traffic flows), resilience (how quickly conditions return to normal after an event), safety (rates of speeding, harsh braking, and harsh acceleration) and idle time (how long vehicles sit stationary with engines running).
Not necessarily; a city with low everyday congestion can still struggle if an event causes a sharp, prolonged spike in traffic, while a city with higher typical congestion but strong recovery and steady traffic flow may handle events more predictably overall.
Publicizing alternate routes and temporarily lowering posted speed limits during events are two low-cost strategies that can encourage steadier traffic flow and help areas return to normal conditions more quickly after an event ends.
For commercial traffic, consistent and predictable travel times matter as much as speed itself, since a truck moving steadily at a slower pace operates more efficiently than one that repeatedly brakes, stops and idles in congestion.
Telematics data for freight planning complements traditional sources. Our checklists share what telematics data can and can’t do to support freight planning.
New data sources for MPO freight planning: 3 overlooked metrics that reveal regional trends before they hit your dashboard.
State DOTs can forecast truck traffic earlier by watching freight metrics from city and port data. Here are 3 signals worth tracking.