
Curb to corridor: How Arizona models last-mile delivery behavior
Our Arizona case study illustrates how to capture true last-mile delivery behavior to inform infrastructure wear and tear, safety, curbside management, and more.

Planners have long treated congestion as the primary barometer of freight network health. It’s visible, measurable and gets political traction. But congestion alone doesn’t tell you whether your freight network is actually working. A city can be congested and still run a reliable freight operation, or it can have clear roads until special event traffic clogs up freight arteries and alternate routes.
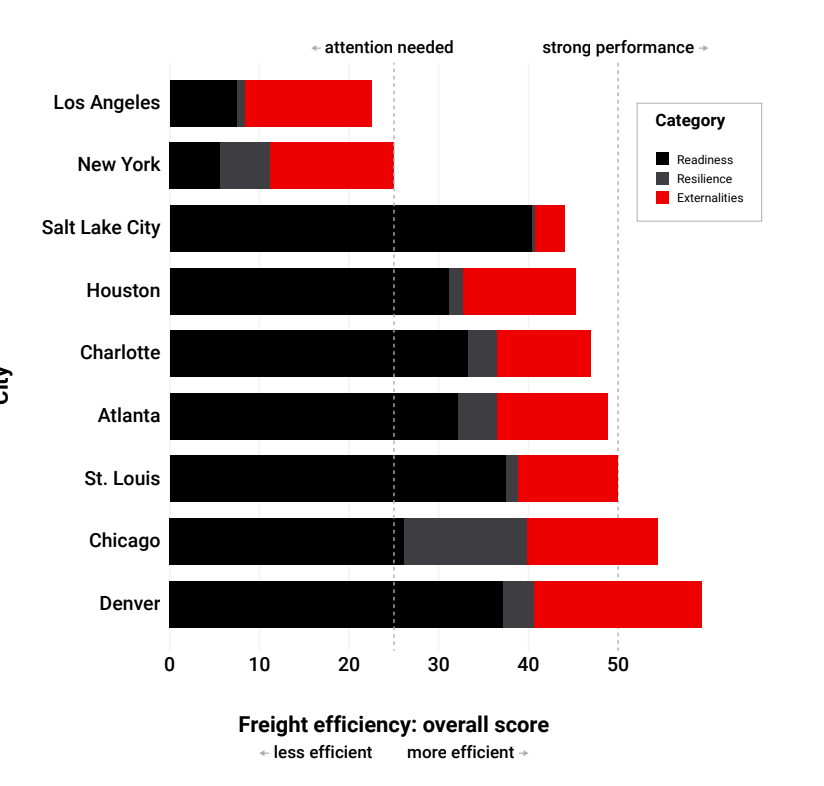
To capture the full picture, Altitude recommends measuring freight efficiency. We developed a multi-part evaluation that includes congestion, idle time, resilience and safety. Combining these factors for an overall result gives you a fuller picture of what’s wrong, and where.
Readiness is the daily baseline — how much friction commercial vehicles encounter on a normal weekday. But our methodology goes beyond raw delays. It measures not just how much congestion exists, but how predictable it is, and how many low-congestion hours the network offers per day.
That distinction matters operationally. Chronic congestion is, in a sense, manageable. Carriers can schedule around predictable peak windows, adjust departure times and price the delay into their operations. Unpredictable congestion — the kind that spikes without warning — is far more damaging. It breaks delivery windows, triggers penalties and disrupts supply chains.
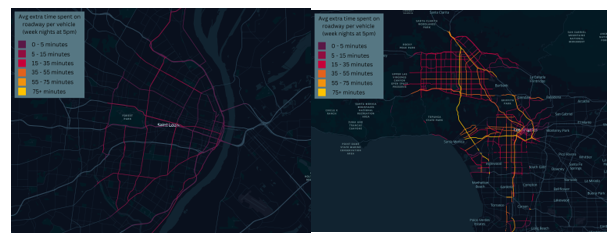
Figure 1: Average extra time spent per vehicle on roadways at 5 p.m. on weeknights in St. Louis (left) and Los Angeles (right). Higher congestion times contribute to lower infrastructure readiness scores.
Lower scores for readiness reflect the difficulty of managing freight in high-density environments built before modern logistics demands existed. The takeaway for planners: Readiness investments should target variability, not just volume. Smoothing the spikes often matters more than reducing the average.
Resilience measures how quickly a network returns to normal after disruption. This could come from minor events like concerts and sporting games, or major ones like severe weather or infrastructure incidents. This ability to recover is a separate infrastructure problem from daily flow. It requires a different set of investments: alternative routing, cross-agency communication and real-time incident response.
In our freight efficiency analysis of nine cities, Chicago led by a significant margin. This result is attributable to route redundancy, emergency response protocols and institutional coordination rather than simply having fewer cars on the road.
The operational cost of poor resilience is easy to undercount. Missed delivery windows, idling trucks waiting for a corridor to clear, cascading delays through the supply chain — none of these show up in a standard congestion report.
Externalities — measured primarily through vehicle idling — is the metric most likely to be missing from your current planning dashboard. It doesn’t appear in traffic count data. It isn’t visible from aerial congestion maps. But it connects directly to the real costs of wasted fuel, greenhouse gas emissions, driver time and fleet operating budgets.
Cities with temperature extremes risk having high scores here due to vehicles left idling in order to maintain comfortable cab temperatures during stops. But in our analysis, New York and Los Angeles scored well, which we attribute in part to strict anti-idling regulations for commercial vehicles.
That’s the key insight: Idling is the most governable of our metrics. Signal timing, loading zone design, anti-idling policy and dwell-time management all directly shape this number. It’s an area where regulatory and operational levers work faster than capital investment.
Safety measures risk to commercial vehicles on your road network by tracking three categories of unsafe driving: speeding (more than 20% above the posted limit), harsh acceleration and harsh braking. Together, these reveal where road conditions are forcing reactive, dangerous driving rather than smooth freight movement.
Analyzing safety metrics can surface risk before collisions happen. This reveals high-risk corridors that never appear in crash records because the incident hasn’t occurred yet. That inversion matters for planners: You can act on a dangerous segment rather than wait for it to produce a statistic.
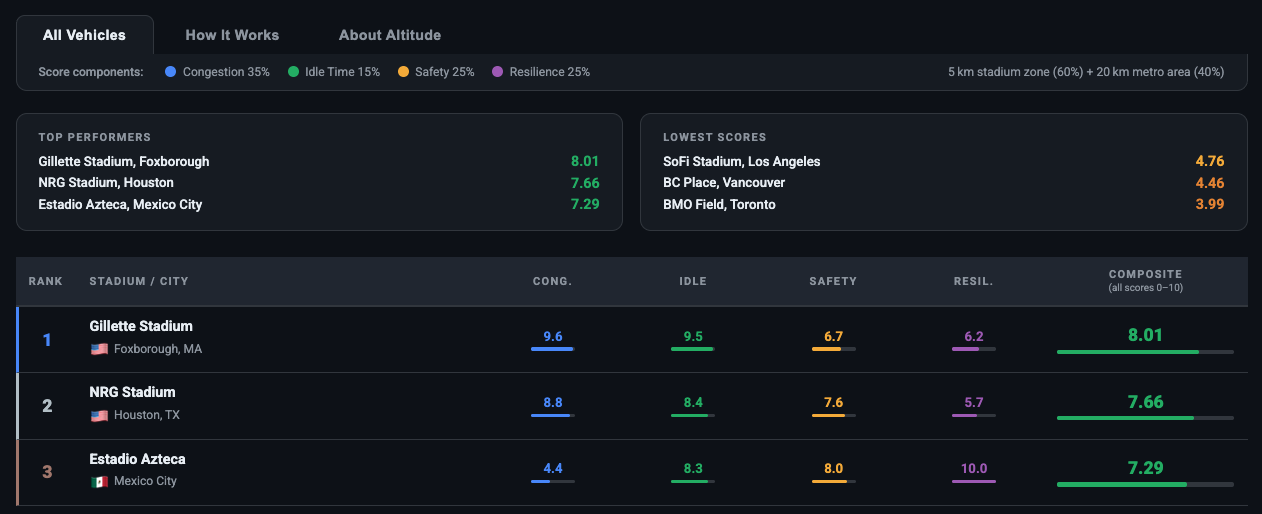
Figure 2: High safety and resilience scores rank Mexico City highly on Altitude’s analysis of host cities of the 2026 soccer tournament.
For example, in our recent study of host cities for world soccer games, Mexico City scored highest on safety metrics, which helped it place third in event preparedness among 16 host cities analyzed. One of the most populous cities in the world, Mexico City has terrible and constant congestion. But its traffic keeps moving, and moving safely.
Like idling, safety is an area where targeted operational interventions — signal retiming, loading zone placement, turn restrictions — often work faster than capital investment. But only if you’re measuring driving behavior, not just congestion.
Each efficiency metric captures a different failure mode. A city can perform well on several but undermine its entire freight network by failing on one critical factor. Planners who only track congestion may invest heavily in lane additions while ignoring idling reduction programs or emergency response coordination.
The combined diagnostic shifts the question from, “How bad is our congestion?” to, “Where specifically is our network breaking down, and what kind of investment fixes it?” That reframe has real budget implications. Resilience improvements often require less capital than capacity expansion, while delivering outsized operational benefits. Externalities programs can reduce costs for carriers immediately, building political support for broader freight initiatives.
The goal isn’t a congestion-free city. It’s a reliable freight network that keeps moving under real-world conditions. Measuring multiple dimensions is how you get there.
How strong is your city’s freight economy? Get the Altitude Freight Efficiency Report to see what factors you should be measuring and improving to keep freight moving in your region.
A data-driven benchmark developed by Altitude by Geotab that ranks cities on multiple factors including infrastructure readiness, resilience, externalities (idling) and safety using real-world commercial vehicle telematics data.
Denver and Chicago rank as the top-performing cities, while Los Angeles and New York rank lowest in Altitude’s analysis of nine major urban areas.
Congestion measures delay but not reliability, recovery speed or wasted idle time. A city can be congested yet run reliable freight operations, or have clear roads that collapse under a single disruption.
Target idling and safety first. Both respond quickly to operational interventions — signal retiming, loading zone management and anti-idling policy — without requiring major capital investment.
The impact is mixed. Congestion pricing can reduce gridlock, but policymakers should also address loading zone management to reduce idling and environmental impact, since idling tends to be an operational challenge rather than a traffic one.
Altitude’s connected commercial vehicles provide data coverage for 99.9% of primary roadways in North America with detailed insights by vehicle type, class, vocation and fuel type at the granular road-segment level.
Our Arizona case study illustrates how to capture true last-mile delivery behavior to inform infrastructure wear and tear, safety, curbside management, and more.
This heavy-duty truck volume analysis shows how toll pricing differences reshape freight corridor behavior at the US-Canada border.
This heavy-duty truck volume analysis shows how toll pricing differences reshape freight corridor behavior at the US-Canada border.