
Curb to corridor: How Arizona models last-mile delivery behavior
Our Arizona case study illustrates how to capture true last-mile delivery behavior to inform infrastructure wear and tear, safety, curbside management, and more.


Trucks were essential to the American war effort during WWII, moving supplies, equipment and materials across the country’s highway network. Much of that traffic traveled Route 66. Commissioned on November 11, 1926, the highway stretched over 2,400 miles across eight states from Chicago to Santa Monica. It carried grain, military convoys and commercial goods long before it became a symbol of American nostalgia.
The travel center industry grew up alongside this corridor. Drivers needed fuel, food and rest. Entrepreneurs built businesses to serve them. Today’s truck stop services market is valued at an estimated $18.5 billion and the road that launched it turns 100 this year.
Route 66 was officially decommissioned on June 27, 1985, after the Interstate Highway System gradually replaced it. I-40, I-44 and I-55 now carry the traffic that once rolled down the original two-lane road. But the corridor did not disappear. It evolved.
I-40 alone stretches 2,556 miles. It connects 65% of all U.S. markets within a one-day truck trip. The I-44 corridor supports over 12,400 freight generators employing 217,000+ workers within three miles of the highway. Together, these interstates form the commercial backbone of the country’s midsection.
The scale of what moves through them is growing. The American Trucking Associations projects truck freight tonnage will reach nearly 14 billion tons by 2035. Trucking revenue is expected to climb from $906 billion to $1.46 trillion over the same period. The eight Route 66 states collectively represent approximately 30% of all U.S. travel activity. For travel center operators, these corridors are where the next wave of infrastructure investment needs to land.
2026 marks Route 66’s 100th anniversary, with celebrations planned across all eight original states. Millions of visitors travel some portion of Route 66 each year. A Rutgers University study conducted in collaboration with the National Park Service found that Route 66 tourism generates $262 million in total economic output annually. Those numbers are expected to climb during the centennial year as media coverage and organized events drive additional traffic to the corridor.
For travel center operators, the centennial is more than a milestone. More visitors and more freight create more demand for well-positioned stops with the right amenities. The real question is what evidence operators are using to decide where to invest. That is exactly what Altitude by Geotab set out to answer at NATSO Connect 2026.
At NATSO Connect 2026 in Albuquerque, Altitude by Geotab presented commercial movement insights along the historic Route 66 corridor. Using aggregated, anonymized insights drawn from over 5 million commercial vehicles, the Altitude platform revealed observed movement patterns along Central Avenue, the historic Route 66 alignment through the city.
The analysis showed vehicle counts, vehicle class breakdowns, hourly and daily travel trends and stop patterns along Central Avenue. Some example findings include:
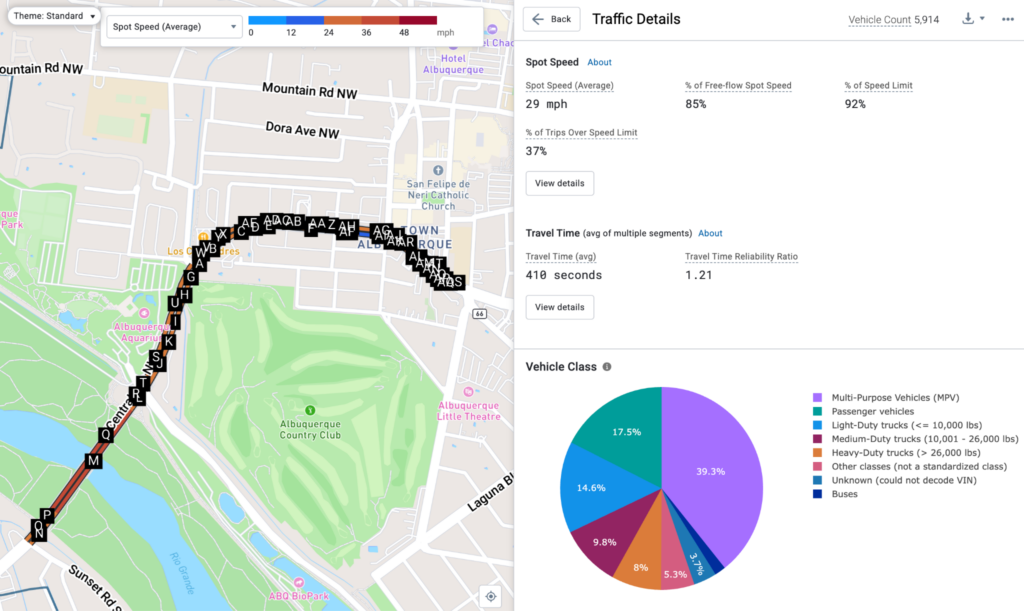
Central Avenue traffic analysis from the Altitude platform showing vehicle counts, class breakdowns and travel speed across the historic Route 66 alignment through Albuquerque. Data covers July 1 through December 31, 2025. Source: Altitude by Geotab, NATSO Connect 2026.
For travel center executives, this kind of granular data moves site selection, capacity planning and truck parking and fueling infrastructure investment from intuition to evidence. Rather than relying on outdated counts or assumptions about corridor demand, operators can see where vehicles stop, how long they stay and what routes feed the most traffic. Altitude’s Stop Analytics and Route Analytics deliver these insights across 99.9% of primary roadways in North America.
Route 66 shaped the travel center industry. The corridors that replaced it carry more freight than ever. As the centennial draws national attention back to these routes, the next generation of travel center leaders will be defined by how well they read the data behind the demand. The infrastructure decisions made today will determine which operators capture that growth for the next hundred years.
See how travel center operators are using commercial movement insights to guide site selection, capacity planning and infrastructure investment along America’s busiest freight corridors.
Route 66 was commissioned on November 11, 1926. Its centennial falls in 2026, with celebrations planned across all eight states the highway originally connected: Illinois, Missouri, Kansas, Oklahoma, Texas, New Mexico, Arizona and California.
Route 66 was decommissioned in 1985 and replaced by five interstates: I-55 (Chicago to St. Louis), I-44 (St. Louis to Oklahoma City), I-40 (Oklahoma City to Barstow, CA), I-15 (Barstow to San Bernardino) and I-10 (San Bernardino to Santa Monica). I-40 covers the longest segment at over 2,556 miles and connects 65% of U.S. markets within a one-day truck trip.
The interstates that replaced Route 66 carry substantial commercial freight. The American Trucking Associations projects truck freight tonnage will reach nearly 14 billion tons by 2035, with trucking revenue growing from $906 billion to $1.46 trillion. The I-44 corridor alone supports over 12,400 freight generators employing 217,000+ workers within three miles of the highway.
Platforms like Altitude by Geotab provide aggregated, anonymized commercial movement insights drawn from millions of commercial vehicles. Stop Analytics identifies where vehicles stop for parking, charging and refueling. Route Analytics tracks journey counts and travel times between locations. These insights help travel center operators make evidence-based decisions about where to build, expand or add amenities.
Route 66 attracts millions of visitors annually and generates over $262 million in economic impact, according to a Rutgers University study conducted in collaboration with the National Park Service. International tourists account for 30-40% of Route 66 business revenue. The eight Route 66 states collectively represent approximately 30% of all U.S. travel activity. These numbers are expected to grow during the 2026 centennial year.
NATSO Connect 2026 took place February 24-26 in Albuquerque, New Mexico, a city located directly on the historic Route 66 corridor. Central Avenue in Albuquerque is the original Route 66 alignment through the city. The event’s location tied into the Route 66 centennial and allowed Altitude by Geotab to present commercial movement insights for the surrounding region.
Our Arizona case study illustrates how to capture true last-mile delivery behavior to inform infrastructure wear and tear, safety, curbside management, and more.
This heavy-duty truck volume analysis shows how toll pricing differences reshape freight corridor behavior at the US-Canada border.
This heavy-duty truck volume analysis shows how toll pricing differences reshape freight corridor behavior at the US-Canada border.