
Curb to corridor: How Arizona models last-mile delivery behavior
Our Arizona case study illustrates how to capture true last-mile delivery behavior to inform infrastructure wear and tear, safety, curbside management, and more.

You know it’s already happening, but would you like the ability to predict when and where unauthorized truck parking will increase? In Altitude’s truck parking study, we found that in urban areas, truck parking is a predictable outcome of key factors that interact at specific network locations.
The highest-congestion areas we analyzed — Atlanta, Indianapolis, New York, Los Angeles, Chicago and Washington-Baltimore — share some analytically interesting characteristics that transportation planners can dig into with telematics and network data. Here are three common factors that our analysis uncovered, along with how planners can use them to forecast truck parking demand.
Every top metro we analyzed is a hub where multiple major interstates intersect, creating a compounding effect from local freight demand plus massive through-traffic from long-haul routes. Atlanta sits at the convergence of I-75, I-85 and I-20. Chicago anchors I-90, I-94, I-80 and I-55. These cities became freight hubs because of their network position, and that same position makes them pressure points for parking demand.
What makes this analytically useful is that interstate convergence creates layered demand that looks different from either purely local or purely through-traffic markets. Planners who treat these metros as a single demand type will underestimate peak pressure, particularly on corridors where long-haul and regional freight overlap.
Analysis takeaway: Corridor-level Vehicle Miles Traveled (VMT) and origin-destination analysis can help planners disaggregate local from through-traffic demand, which is essential for sizing facilities correctly and locating them where they’re available to support long-haul trucks before illegal parking occurs.
Altitude’s journey analysis shows the median ramp parking event follows approximately 520 miles and 9.7 hours of driving — figures that align closely with Hours of Service (HOS) limits under federal regulations. The metros with most unauthorized parking tend to fall at natural “HOS exhaustion points” along major corridors, the distance at which drivers departing from major origin cities run out of legal driving time.
This is one of the most powerful insights for truck parking demand forecasting because it means demand isn’t just a function of how many trucks are in a region, but where those trucks started and how long they’ve been moving. A driver leaving Memphis at noon will hit HOS limits in Atlanta by evening. A driver leaving Philadelphia will exhaust legal drive time somewhere in the Ohio-Indiana corridor. These are geometrically predictable given departure location, departure time and route.
Analysis takeaway: Planners can model their city’s potential for truck stops by overlaying HOS limits onto corridor origin-destination data, effectively building a demand heat map that predicts where parking pressure will crystallize before it shows up as an enforcement problem.
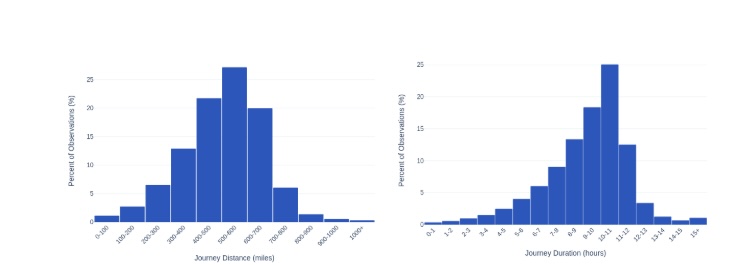
Figure 1: The distribution of journey distance (left) and journey duration (right) prior to ramp parking reveal that the median ramp parking event comes after a 520-mile trip, or just under 10 hours of driving.
All high-frequency parking areas show the same overnight peak between 8pm and 5am, suggesting the problem isn’t just about the number of trucks but about the synchronization of HOS limits with delivery scheduling. Trucks that must deliver during daytime receiving windows may be parking to wait overnight in close proximity to their destination, whether or not legal parking is available.
Analysis takeaway: Time-of-day analysis of parking demand versus facility capacity can give planners a clearer picture of whether a shortage is a capacity problem, a timing problem or both. Operational interventions like off-peak delivery incentives may reduce peak pressure without requiring new infrastructure, though in the most constrained metros, supply-side solutions will still be necessary.
Given that urban metros have such high land costs, truck parking is economically unviable to develop privately. This puts the urban parking problem squarely on the shoulders of planners, not corporate partnerships or incentives. The good news is that the same data that reveals this problem — telematics, corridor VMT, HOS patterns — gives planners the tools to get ahead of it.
Ready to move from recognizing the problem to securing infrastructure funding? Download the full truck parking demand analysis to see the corridor-level data you need to justify capacity investments and make meaningful safety gains.
It’s largely a consequence of federal Hours of Service (HOS) rules colliding with a shortage of authorized spaces. Altitude by Geotab’s analysis of over 120,000 long-duration ramp parking events found a median journey of 520 miles and 9 hours and 40 minutes of drive time preceding a ramp parking event — just short of the 11-hour HOS driving limit. Drivers approaching that limit face a stark choice: Park wherever space exists, or risk violations by searching further.
Extremely serious and worsening. The most recent nationwide inventory under Jason’s Law found approximately 313,000 truck parking spaces across the U.S. — roughly 40,000 at public rest areas and 273,000 at private truck stops — with public spaces growing just 6% and private spaces 11% from 2014 to 2019, far behind overall freight growth.
Momentum is building. For example, authorized truck parking is a new category for grants from Safe Streets and Roads for All (SS4A). With this new emphasis, SS4A is elevating safe truck parking to a national level.
Yes, with the right data. Altitude’s research shows that HOS exhaustion points are geometrically predictable — a driver’s departure city, departure time and route determine where they will run out of legal driving hours. Altitude’s Stop Analytics module tracks hourly parking events to show whether trucks remain parked over time, giving planners a signal of actual demand versus arrival counts — and identifying where capacity is maxed out by hour, day and season.
Our Arizona case study illustrates how to capture true last-mile delivery behavior to inform infrastructure wear and tear, safety, curbside management, and more.
This heavy-duty truck volume analysis shows how toll pricing differences reshape freight corridor behavior at the US-Canada border.
This heavy-duty truck volume analysis shows how toll pricing differences reshape freight corridor behavior at the US-Canada border.