
Commercial vehicle AADT: the most accurate estimates at national scale
This heavy-duty truck volume analysis shows how toll pricing differences reshape freight corridor behavior at the US-Canada border.


Commercial vehicle traffic is a critical element of calculating managed lane pricing potential. Heavier vehicles typically pay higher tolls, and many toll roads also use demand-based pricing, so simply extrapolating commercial traffic from total vehicle counts can create imprecise revenue models.
To show what commercial vehicle intelligence looks like in practice for toll road operations and revenue modeling, Altitude analyzed the impact commercial vehicles have on toll road operations, particularly for revenue modeling. To find out, we looked at Interstate 77, which runs north-south from South Carolina to Ohio.
Using our Corridor O-D module, we looked at four months of commercial vehicle activity (Oct 2025 – Mar 2026) across both directions of 26 miles of express-lane toll road bisecting Charlotte, North Carolina. Unlike traditional traffic counts, this analysis includes vehicle classification by gross weight, vocation, fuel type and industry — dimensions no sensor or loop detector provides. We found relevant insights for toll operations, public-private partnerships, turnpike authorities, congestion price modeling, engineering firms and maintenance agencies.
By creating an O-D matrix for commercial traveling through the Charlotte area, we were able to identify captive demand. In other words, there are no toll-road bypass alternatives. All of the observed freight volume in the zone runs on the I-77 mainline.
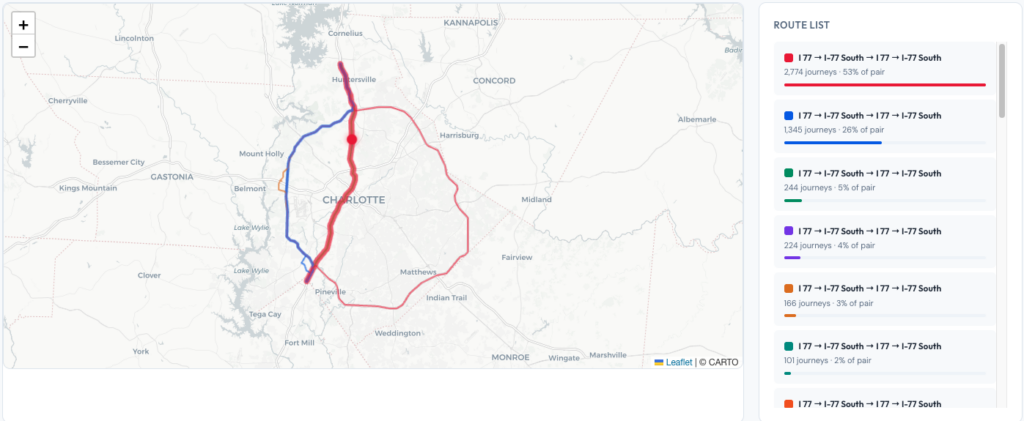
Figure 1: An O-D corridor analysis of I-77 commercial traffic shows that the toll road section has no alternate routes, creating captive managed lane pricing demand.
When there is low (or no) competition for a route, vehicle usage can be more accurately forecast. For a toll road, that means financial models are more trustworthy and lower risk.
Breaking out vehicle types, our analysis identified 83% of the commercial traffic as Heavy-Duty trucks. Vehicle type is a critical piece of toll data because HD trucks generate 2-3x the revenue per pass under axle-based pricing. Of the commercial vehicles observed, 94% are trucks — 83% heavy-duty, 11% medium-duty. This makeup reveals an effective toll yield that is substantially higher than raw journey counts would suggest.
We turn to vehicle vocation to learn what commercial trucks are doing, so that we can better understand why they are making those trips. We found that 84% are long-haul or regional service. Long-haul carriers (52%) operate on contracted delivery schedules where a late arrival costs far more than any managed lane toll. Regional operators (32%) are a captive base due to their service area. Both types of trips are schedule-sensitive and toll-tolerant, so these are the commercial segments most willing to pay for express lane reliability.
We found that the midday freight surge is a distinct revenue window for demand pricing. Of the daily trip volume, 29% happens between 10 AM and 1 PM — a midday commercial freight peak that’s distinct from the traditional AM/PM commuter pricing windows. Dynamic pricing on both North and South express lanes on I-77 could capture this revenue opportunity.
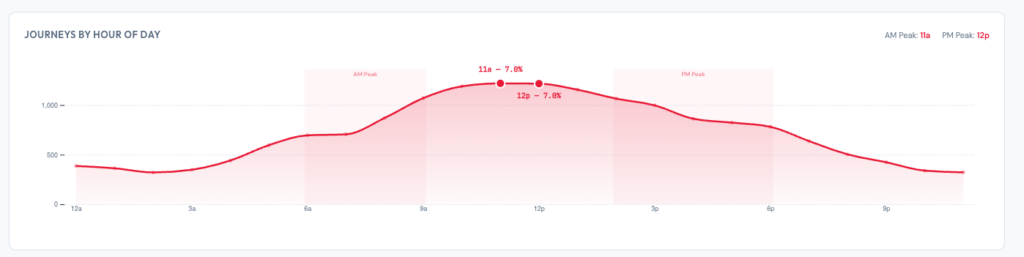
Figure 2: Analyzing commercial vehicle journeys by day part shows a clear surge that is distinct from traditional commuter peak travel times.
This is a business-day corridor, not a recreational one, with 84% of traffic moving on weekdays, with the peak on Wednesday. Weekend volume drops to 16%. This weekday concentration reduces weekend revenue risk and supports a commercial-vehicle-optimized pricing structure.
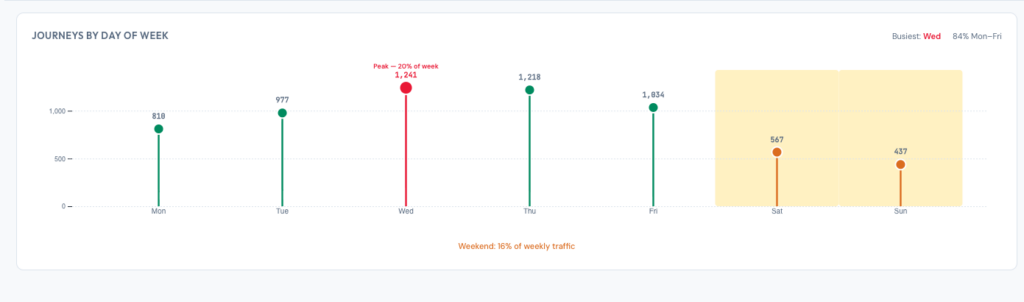
Figure 3: Supporting the hypothesis that I-77 is primarily a commercial corridor, travel-by-day analysis shows a significant dropoff on weekend travel.
Seasonal demand along this toll corridor is cyclical, not structural. This shows up in an October peak (753 journeys) which drops 41% to a January trough (442), but then recovers by March (488). The winter dip is a two-month window, which toll operators can use to model January as the debt service stress test, not the baseline.

Figure 4: Monthly travel analysis shows a two-month dropoff in commercial trips during January and February.
Our I-77 study shares insights that challenge some traditional toll-road assumptions and reveal pricing opportunities — particularly in the details about vehicle vocation and trip time of day. For trustworthy modeling and optimal operations, toll road analytics must dig deeper than simple truck counts.
Curious about how your region’s freight travel impacts the local economy? Get the Altitude Freight Efficiency Report to see what factors you should be measuring and improving to keep freight moving in your area.
Vehicle mix, time-of-day demand patterns and the availability of bypass alternatives are the primary drivers. Understanding how these factors interact — particularly on freight-heavy corridors — is essential for setting rates that maximize revenue without suppressing usage.
Commercial vehicles, especially heavy-duty trucks, behave differently than passenger cars. They tend to be schedule-sensitive and less price-elastic, which means they warrant separate treatment in any demand-based pricing model.
When data shows demand patterns that don’t align with commuter peaks — such as a midday freight surge — static pricing windows leave revenue on the table. Dynamic pricing works best when it reflects actual corridor demand, not assumed behavior.
The lowest-demand period in the corridor’s annual cycle, not the average, makes a stronger baseline. Stress-testing against the trough gives lenders and operators a more defensible picture of downside risk.
This heavy-duty truck volume analysis shows how toll pricing differences reshape freight corridor behavior at the US-Canada border.
This heavy-duty truck volume analysis shows how toll pricing differences reshape freight corridor behavior at the US-Canada border.
Altitude by Geotab and CATT Lab bring Stop Analytics into RITIS, giving DOTs and MPOs access to observed truck stop data from 6 million commercial vehicles.