Commercial vehicle AADT: the most accurate estimates at national scale
This heavy-duty truck volume analysis shows how toll pricing differences reshape freight corridor behavior at the US-Canada border.

There’s a last-mile delivery van parked outside a building on your corridor right now. It’s been there for 45 seconds as the driver dashes into a building with a package. In a moment the truck will be gone, replaced by another one three blocks away doing the same thing. And if you’re relying on traditional transportation data for last-mile delivery insights, you’re not capturing these movements correctly.
Last-mile delivery vehicles — the parcel vans, waste collection trucks and food delivery services that weave through urban streets making dozens of stops a day — are one of the fastest-growing forces reshaping how our road network actually functions. Yet for most transportation planners, they remain effectively invisible in the data.
That invisibility is becoming a problem for planners.
Last-mile delivery isn’t a niche trend anymore. It’s a structural shift in how goods move. Last-mile delivery costs have grown from 41% of total shipping costs in 2018 to 53% in 2024 — meaning more than half of everything spent moving goods through the supply chain now happens on the final leg, on your streets and in your corridors, competing for your curbside space.
For transportation planners, this isn’t an abstract logistics statistic. It means that a growing majority of commercial vehicle activity on urban and suburban roads is last-mile in nature. If your data can’t distinguish those vehicles from through-traffic, your congestion models, emissions analyses and infrastructure investments can easily take a wrong turn.
The problem starts with how stops get counted — or don’t.
A last-mile delivery driver might make 30 stops in a single shift. But many of those stops last less than a minute, with the engine idling while a package gets dropped at a door. Traditional telematics systems typically require an ignition shutoff or an idle period exceeding 200 seconds before recording a stop. Under those definitions, an entire day of delivery work can look like one continuous drive.
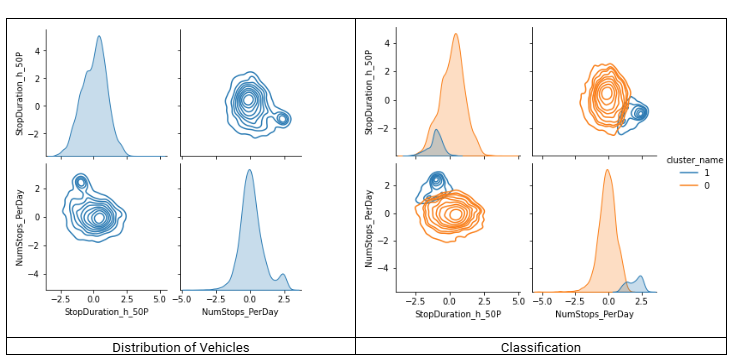
Figure 1: Altitude’s model plots average stops per day against average stop duration to identify natural data clusters that separate true last-mile delivery from other short-stop curbside traffic. The orange highlighted group represents vehicles with high stop frequency (>27 stops/day) and very short durations (<108 seconds).
The result: That curbside delivery truck making 45-second stops through a residential neighborhood is functionally indistinguishable, in your data, from a long-haul truck passing through.
This isn’t a minor data quality issue. It’s a systematic blind spot that compounds as last-mile activity grows.
When you move beyond trip-level data to analyze vehicle behavior at the duty-cycle level — capturing every change in vehicle status, including micro-stops measured in seconds — a distinct behavioral signature emerges for last-mile vehicles.
Door-to-door vehicles cluster tightly around a specific pattern: more than 27 stops per day, with average stop durations under 108 seconds. This isn’t an arbitrary threshold invented by an analyst. It’s a natural boundary that emerges from the data itself when you let machine learning find where behaviors actually separate, rather than imposing human-defined cutoffs.
That distinction matters for planning credibility. A classification built on observed behavioral reality is far more accurate for infrastructure planning than one built on assumptions about what a delivery truck “should” look like.
Once you can actually see last-mile vehicles in your data, several planning questions get sharper:
Curbside management. Door-to-door vehicles are the primary driver of curbside competition in commercial corridors. Isolating their volume, timing and location gives cities the evidence they need to right-size loading zones, enforce commercial parking windows and reduce the double-parking that creates safety hazards for cyclists and pedestrians.
Grant narratives. Federal freight funding programs increasingly ask for behavioral evidence, not just vehicle counts. Being able to say “door-to-door delivery vehicles account for X% of commercial vehicle activity on this corridor, averaging 30 stops per day” is a materially stronger foundation for a funding request than “we counted 200 trucks.”
Congestion and signal timing. A high concentration of door-to-door stops in a corridor signals economic activity, not just traffic volume. That distinction matters when you’re deciding whether to optimize signal timing for throughput or add dedicated commercial vehicle infrastructure.
Emissions modeling. Last-mile vehicles are strong candidates for electrification programs because they operate within defined geographic ranges, return to a home base regularly and follow predictable duty cycles. But you can only model electrification potential accurately if you can first identify and separate this fleet from the broader commercial vehicle mix.
There’s one more reason to pay attention to how last-mile vehicles are classified: regulatory alignment. The local vocation threshold (activity within 150 air-miles) maps directly to the FMCSA short-haul Hours of Service exemption. When your data classifications match the regulatory frameworks embedded in federal funding programs, the translation from analysis to application becomes much smoother.
The road network was not designed with 30-stop delivery routes in mind. The curbside was not designed for the volume of commercial activity now competing for it. And planning tools built around vehicle class and simple counts were not designed to answer the questions that last-mile growth is now forcing onto planners’ desks.
The good news is that the behavioral data exists to fill this gap. The analytical methods to make it explainable and defensible have matured significantly.
Understanding the “why” behind freight movement isn’t just a data science problem. It’s the foundation of planning decisions that will shape how goods move through our communities for the next decade.
Learn how behavioral classification works across all five freight vocations — local, regional-haul, long-haul, hub-and-spoke and door-to-door: Get the full Vehicle Vocation white paper to see the methodology, the metrics and what it means for your next freight plan.
This heavy-duty truck volume analysis shows how toll pricing differences reshape freight corridor behavior at the US-Canada border.
This heavy-duty truck volume analysis shows how toll pricing differences reshape freight corridor behavior at the US-Canada border.
Altitude by Geotab and CATT Lab bring Stop Analytics into RITIS, giving DOTs and MPOs access to observed truck stop data from 6 million commercial vehicles.