Freight route planning for events: Soccer cities with the best traffic stats
See how freight route planning for weekday events can cut harsh braking risk. Real traffic data from Leo Messi and Cristiano Ronaldo’s June games reveals why.


When a major international racing event shut down Las Vegas Boulevard, many expected a traffic and commercial nightmare. Local businesses feared that restricting this main artery would paralyze the supply chain.
But data from Altitude by Geotab reveals a logistical success story, and a new model for data-driven special event traffic management plans. Here’s how and why the city’s diversion plan worked.
Formula One raced in Las Vegas on November 22, 2025 down Las Vegas Boulevard, otherwise known as “the Strip.” We analyzed commercial movement on race day versus the previous Saturday (Nov 15, 2025) to study how commercial vehicle movements changed in the Las Vegas area during the event.
The success of the outer loop diversion is a textbook example of a special event traffic management plan executed with precision, and the data to prove it.
The Strip was open to limited traffic during “warm track” hours, but closed during race time. The numbers prove that trucks kept moving successfully around the city at all hours despite the disruption. At the heart of the closure zone, commercial traffic on South Las Vegas Boulevard dropped by 18% as freight traffic successfully steered clear.
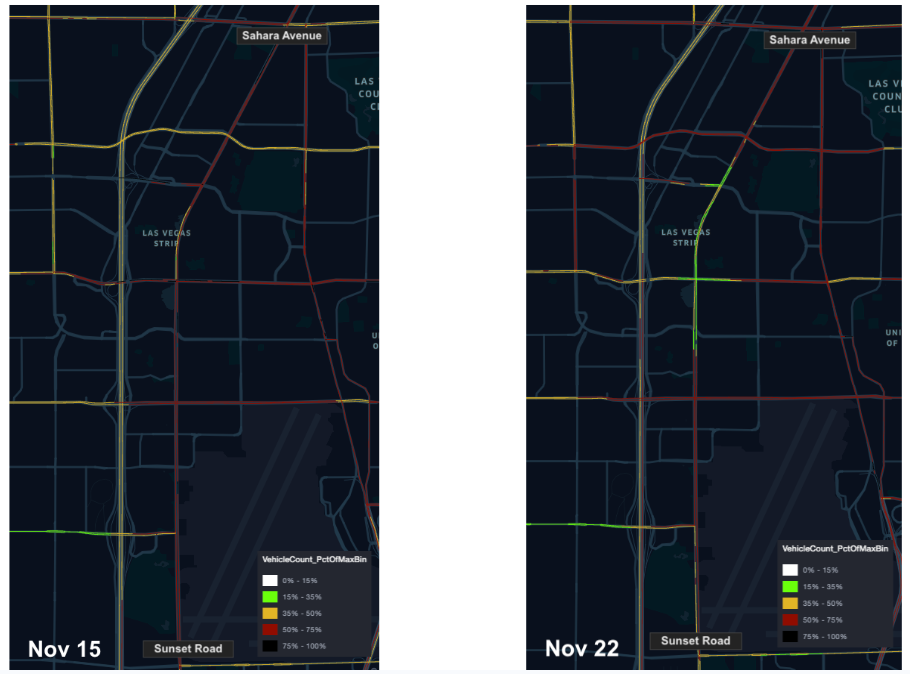
Figure 1: As road closures tightened around the race circuit, commercial activity on South Las Vegas Boulevard between Sahara Avenue to Sunset Road dropped by 18%.
City planners scheduled a rolling countdown of alerts beginning about nine months in advance of race day. The recommended “Outer Loop” detour proved successful. Analysis shows an increase in truck traffic on the strip on race day, but we can assume those vehicles were infrastructure, catering, and other race support vehicles because the data shows an even bigger jump in commercial travel along the outer loop.
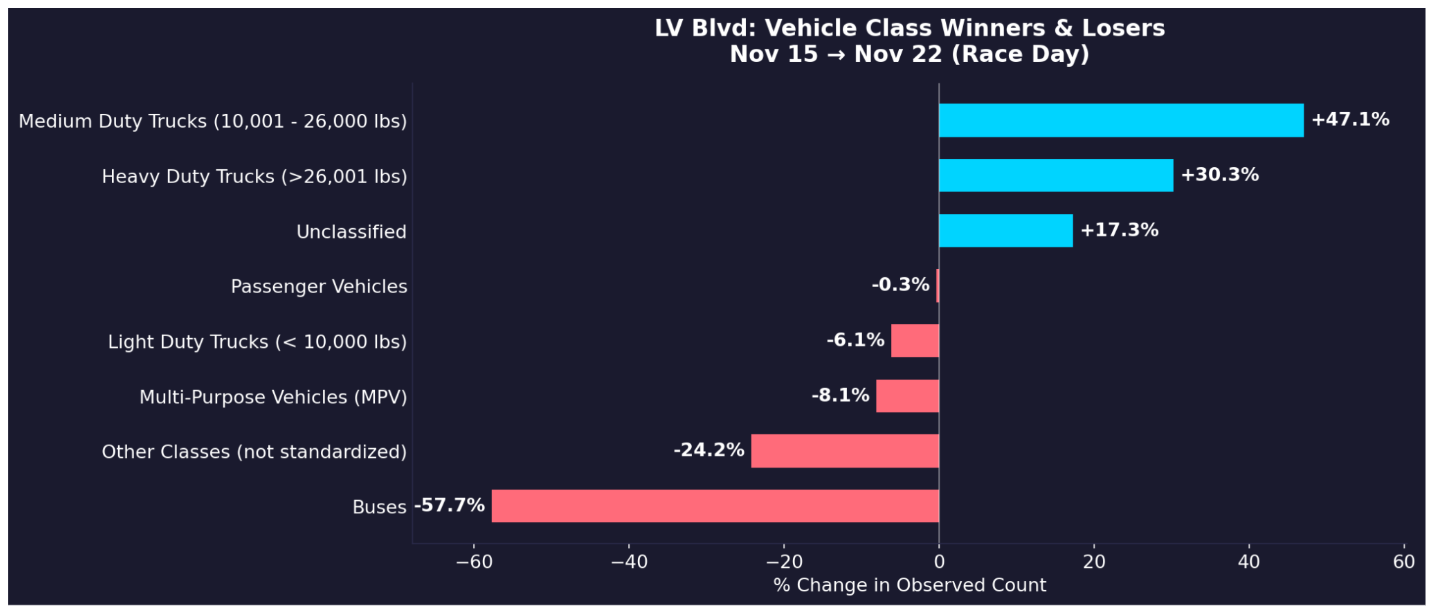
Figure 2: Commercial traffic increased along Las Vegas Boulevard for race support vehicles on the special event day, but dropped for multi-purpose, light-duty, passenger and tourist travel.
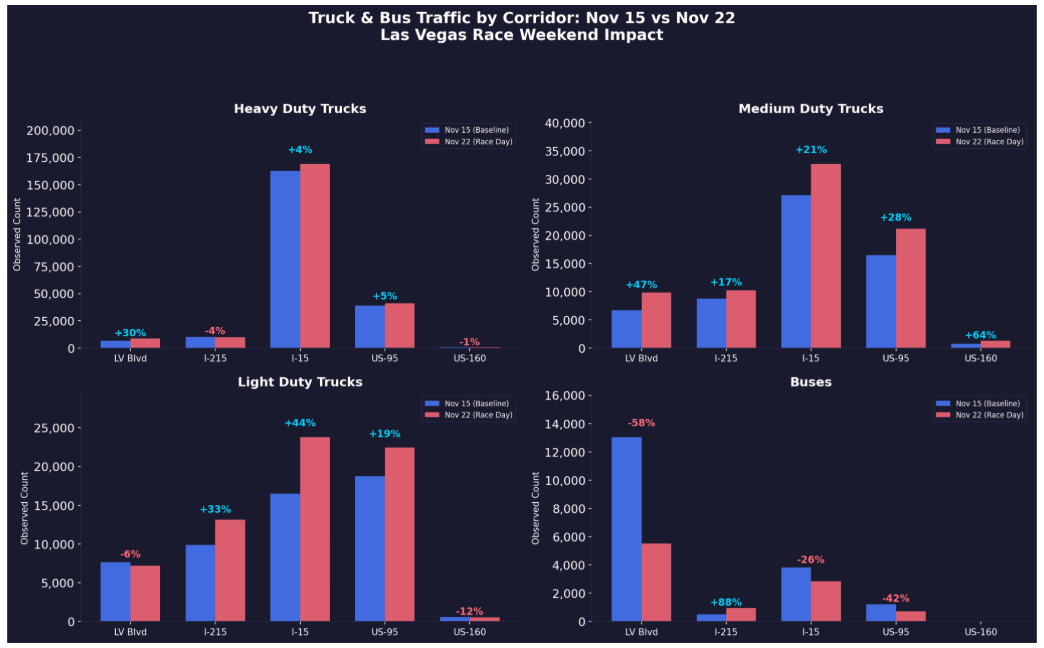
Figure 3: Although freight movement increased along Las Vegas Boulevard on race day, even more shifted to planned alternate corridors around the city.
As commercial drivers actively avoided the race corridor, key regional arteries became the new essential routes. Freight volume shifted to three key corridors:
This massive displacement of volume kept the city’s shelves stocked during the potential travel disruption.
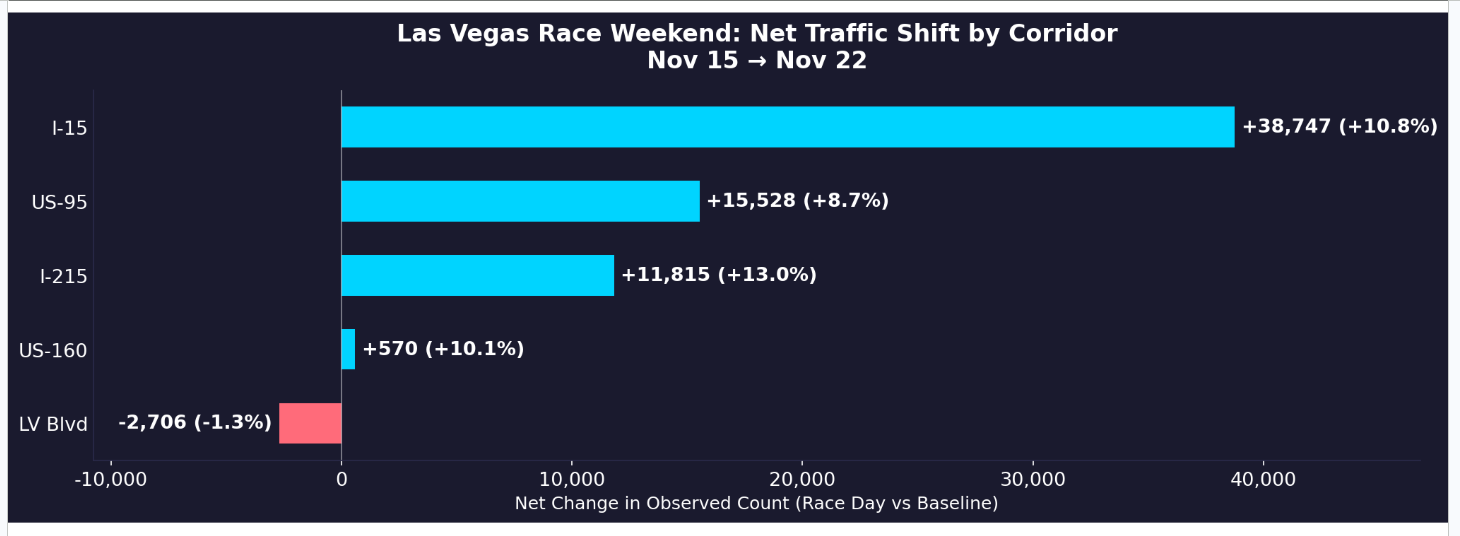
Figure 4: Data from a successful traffic management plan: I-15 saw the largest rise in commercial traffic during race day.
City planners and transportation agencies now have a clear, data-backed special event traffic management plan framework they can replicate for any high-profile event.
The data proves that any major city can, with data-supported planning, shut down its main highway for a mega-event without paralyzing local commerce. By precisely measuring the success of these traffic detours, city planners and transportation agencies can collect the clear, undeniable evidence needed to justify future road closures and create better, smarter traffic strategies for high-profile events.
To keep freight moving during major events, you need data that identifies long-haul, last-mile and other commercial vehicle categories. Get our vocations white paper to learn more.
See how freight route planning for weekday events can cut harsh braking risk. Real traffic data from Leo Messi and Cristiano Ronaldo’s June games reveals why.
Toll changes at the US-Canada border shifted truck traffic — and revealed the hidden freight congestion impact on delivery times, penalties and regional economic health.
Our Arizona case study illustrates how to capture true last-mile delivery behavior to inform infrastructure wear and tear, safety, curbside management, and more.