Commercial vehicle AADT: the most accurate estimates at national scale
This heavy-duty truck volume analysis shows how toll pricing differences reshape freight corridor behavior at the US-Canada border.


Our Curb to Corridor blog series delivers a data-driven framework at every scale.
From last-mile to regional to long-haul, these insights propel your freight story forward.
Transportation planning for retail used to mean mall-access turning lane studies and adequate passenger vehicle parking. Today, last-mile delivery behavior shifts that activity. Instead of hundreds of individual vehicles traveling to one shopping center, one stop-and-go commercial vehicle visits hundreds of shoppers.
Door-to-door delivery is growing, but last-mile transportation metrics remain largely hidden. Without the right analysis, that delivery van appears as a single Origin-Destination trip from the warehouse to its half-hour lunch break, failing to capture its true multiple-quick-stops activity.
Altitude’s door-to-door vocation classification reveals this emerging travel pattern, helping planners adapt to changing road and curbside use. A recent case study in Arizona illustrates how this door-to-door vehicle vocation data solves a real modeling gap: last-mile delivery forecasting.
In a simple representation of today’s complex supply chain, there are three stages of activity. The “first mile” moves raw goods from their origin to manufacturing facilities; the “second mile” ships finished goods to storage and distribution warehouses; and the “last mile” gets product into consumer’s hands, either via retail stores or at the doorstep.
Last mile can be further broken into multiple types of transportation, most commonly business-to-business sales, business-to-consumer sales and an emerging group of consumer-to-consumer sales via online shopping platforms.
Each of these commercial transportation activities has different origin, routing and delivery patterns, and they can only be captured by an analytics platform that recognizes and can categorize last-mile behavior.
As commercial vehicle patterns shift, planners risk falling behind on how to respond to and prepare for changing travel demand. With a more accurate model, planners can address multiple commercial travel issues beyond merely congestion and infrastructure wear and tear.
For example, a last-mile model supports more accurate vehicle miles traveled data (VMT), specifically in densely populated areas where there is a higher demand for parcel delivery. A better understanding of VMT and time-of-day patterns informs congestion management strategies and policies.
Sustainability analyses rely on accurate VMT for emissions modeling. A last-mile travel demand model offers a better estimation of the environmental impact of these types of trips.
The data can be used for site management, including demand for parking locations or pickup and drop off requirements. There are also safety implications for these larger vehicles (vans or light to medium duty trucks) making trips and stops within residential areas. Planners must consider those vehicles differently than passenger cars.
The data can also be used for a new generation of mobility solutions such as considering micro hubs or local distribution centers, especially within dense areas.
Finally, the data is critical for truck trip estimates for urban congestion mitigation policies, which can include off-peak delivery regulations. In Arizona, a team of planners decided to create a model to capture the nuances of this growing segment of commercial transportation to better understand the shift in travel activity behavior.
A recent partnership between the Maricopa Association of Governments (MAG) and a professional services firm leveraged Altitude’s data to focus on door-to-door delivery. The team developed a dedicated framework for a new model to forecast e-commerce and last-mile delivery truck trip behaviors.
The project had several goals:
Using a two-sided modeling approach, planners focused not just on the delivery end of the trip, but the origin as well. Identifying travel patterns for both demand and supply required two different modeling approaches:
Demand side — forecasting parcel volume by traffic analysis zone (TAZ) using land use and demographics
Supply side — routing parcels from depot to destination using service area partitioning and network schema
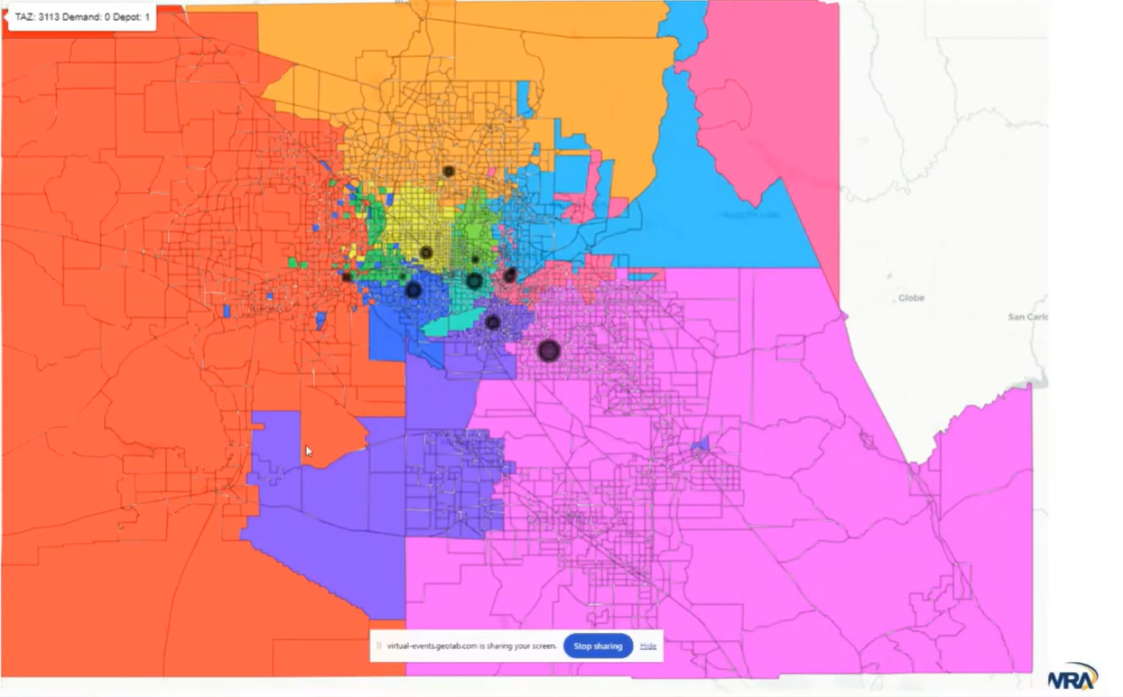
Figure 1: Map of last-mile delivery service locations (black dots) with their corresponding service area (colored zones) for last-mile analysis.
Altitude’s role in the project was to provide data for calibrating and validating the models. Our commercial transportation analytics uses real operational data from more than six million connected commercial vehicles. Because we are able to classify those vehicle movements by vehicle vocation, or use, the data can isolate last-mile activity from other types of commercial travel, including long-haul, regional and hub-and-spoke.
During the Arizona project, planners found several key takeaways for building this type of model.
Existing travel demand models built on passenger and freight vehicle trips cannot fully capture the growing shift to last-mile delivery. Modelers and planners need different types of modeling and tools to capture this travel behavior, and Altitude offers access to a more detailed and nuanced level of information and operational detail.
By leveraging Altitude’s commercial vehicle data, planners in Arizona were able to identify last-mile delivery trips, and quantify the stops associated with them, then extract the operational characteristics of those types of trips. The analysis reveals a new framework that establishes a foundation for enhanced e-commerce demand forecasting.
Watch our webinar, “From Data to Decisions: The Arizona Regional Webinar” to see more insights about this last-mile delivery behavior analysis.
Traditional travel demand models treat delivery vehicles as simple origin-destination trips, missing the stop-heavy reality of last-mile routes. Capturing curbside activity requires stop analytics data — not just trip generation — to measure dwell patterns, stop frequency, and time-of-day behavior. Vehicle vocation classification is also essential to isolate delivery behavior from other commercial vehicle activity.
Last-mile delivery requires a dedicated two-sided modeling framework: a demand side that forecasts parcel volume by traffic analysis zone using land use and demographics, and a supply side that routes parcels from depot to destination using service area partitioning. Existing passenger and freight models cannot adequately capture stop-chaining behavior, so a separate framework built on commercial vehicle telematics data is needed.
Conventional models undercount commercial VMT in dense areas because they fail to capture the multiple short stops a single delivery vehicle makes throughout the day. Since parcel delivery demand is highest in populated areas, this gap is most pronounced precisely where accurate VMT data matters most for congestion management and emissions modeling.
Effective e-commerce forecasting requires anonymized commercial vehicle telematics that identify trip chaining and high-frequency stop behavior, combined with land use and demographic data at the TAZ level. Vehicle vocation classification — which filters by delivery behavior rather than vehicle type — is critical to isolating last-mile trips from broader commercial vehicle activity.
This heavy-duty truck volume analysis shows how toll pricing differences reshape freight corridor behavior at the US-Canada border.
This heavy-duty truck volume analysis shows how toll pricing differences reshape freight corridor behavior at the US-Canada border.
Altitude by Geotab and CATT Lab bring Stop Analytics into RITIS, giving DOTs and MPOs access to observed truck stop data from 6 million commercial vehicles.