Skip to Main Content

The long view: Optimizing fuel retail networks for the next generation of commercial demand

Key Insights

  • Structural commercial demand — driven by freight contracts, Hours of Service regulations, and high-volume fills from Class 3–8 vehicles — creates a predictable base load that stabilizes fuel retail network performance through economic cycles.
  • Frequency of commercial stops, concentrated in early morning and late-night windows, allows operators to align staffing, services, and capital planning with real driver behavior rather than broad traffic estimates.
  • The same commercial movement dataset that identifies diesel hotspots today also reveals where electrifiable fleets operate, giving retailers a data-grounded path to place EV charging infrastructure where utilization will be reliable.

What will the fuel retail landscape look like ten years from now? How do you build a network that performs through economic cycles and through the transition to new fuels? These questions define the next era of fuel retail

Short-term tactics can lift quarterly results, but they do not build resilience. A data-driven business strategy does. It reveals the structure of the commercial market, the rhythm of its demand and the signals that show where future fuels will take hold.

The factors that drive site profitability are complex, but they are measurable. Pump prices fluctuate and congestion patterns change over time, but the commercial movement that supplies a site’s base volume remains predictable. Freight demand, regulatory requirements and habitual stops create a dependable foundation that operators can plan around. When retailers understand that base load at scale, it provides a stabilizing force that supports performance through economic cycles.

That foundation becomes even more important as the market shifts toward a mix of diesel, electric and other alternative fuels. The networks that thrive in that environment will be the ones built on observable truth, not intuition.

The foundational pillars of a resilient network

A resilient network depends on three linked forces that shape commercial fueling. The first is structural demand, which provides stability through every economic condition. The second is frequency, which converts that stability into recurring revenue. The third is data, which ties the present to the future by revealing where new forms of energy will emerge. Together, these pillars create a strategy that prepares operators for the decade ahead.

Anchor network performance in commercial baselines

Resilience begins with the types of demand that do not disappear when the market softens. Freight continues to move in every economy because it supports the basic functioning of society. Shipments follow contracts and schedules rather than sentiment or preference. Every mile driven consumes fuel, and that consumption can be forecast with a high degree of certainty.

Regulation strengthens this foundation. Hours of Service rules require drivers to stop after set driving intervals, and these mandated breaks create predictable fueling windows that occur on the same corridors day after day. These stops also create reliable windows for food, restrooms and safe parking, turning required downtime into a consistent source of in-store demand. The resulting dwell time supports higher-margin sales and gives retailers a natural opportunity to refine their offerings. Since these breaks are tied to compliance rather than personal choice, they form one of the most reliable sources of commercial demand.

The scale of this movement is equally important. Class 3 through 8 vehicles consume more than 20% of all U.S. fuel. Class and long-haul trucks alone use nearly two-thirds of freight fuel. A heavy-duty truck often takes between forty and one hundred gallons in a single fill, compared with about thirteen for a passenger car. 

Bigger fills deliver more revenue, and they occur on consistent schedules. This concentration of high-value activity forms the structural base of every long-term growth strategy in fuel retail.

Turn repetition into revenue by focusing on corner quality

Structural demand establishes a foundation, while frequency turns that foundation into growth. Long-haul trucks average more than sixty thousand miles each year. Local and regional fleets add between thirteen and twenty thousand. These miles create a cycle of repeat visits that operators can measure and plan around.

Commercial movement insights show how this cycle behaves throughout the day. Commercial drivers often refuel during early morning or late-night windows when commuter activity is low. Aligning resources with these patterns increases throughput without requiring new construction. Staffing, food preparation, cleaning schedules and maintenance can be matched to real behavior, turning idle hours into profit.

These adjustments support a long-term growth strategy by improving forecasting and reducing volatility. Knowing how often commercial vehicles return to a site allows operators to anticipate volume and make the appropriate accommodations. Stability at this level creates room for pricing discipline instead of reacting to competitors, especially when route dynamics make the stop essential for key fleets. It also supports stronger margin performance by giving operators a steadier baseline to plan against and reducing reliance on short-term promotional tactics.

Predictable frequency also improves capital planning by helping define the quality of the corner. Showing which sites attract enough repeat commercial traffic provides the evidence needed to justify larger canopies, additional fueling positions, or expanded food service. Operators who understand route-level demand can place future investments where they will generate reliable returns. Instead of chasing broad traffic counts, they can follow the customers who consume the most fuel. Over time, this consistency compounds, reinforcing the network’s ability to grow without unnecessary expansion.

Use customer insights to strengthen long-range planning

The next decade will not replace diesel, but it will introduce new fuels alongside it. Electric and alternative fuel vehicles will grow first in segments shaped by short routes and fixed duty cycles. These early adoption patterns are predictable because they follow the same commercial behaviors that drive diesel demand today.

Those behaviors are captured by commercial movement insights. These insights used to locate diesel hotspots also show where electrifiable fleets already operate. Last-mile delivery, regional haul and other short-range segments follow consistent routes with identifiable dwell patterns. These signals reveal where early heavy-duty charging hubs will achieve reliable utilization.

By observing these patterns, operators can identify the corridors where charging demand will form and plan assets along routes already supported by strong freight movement. The transition becomes less about prediction and more about alignment as stable freight corridors reveal where future fueling demand will take shape.

Maintaining a single movement dataset across fuels strengthens this advantage. The same information that highlights diesel opportunity today can identify future sites for charging or hydrogen stations. Institutional knowledge grows rather than resetting with each technology shift, creating a network that adjusts faster than the market around it.

A data-driven business strategy also improves macro-level planning. Movement trends reveal how freight volumes shift, how regional markets change and where long-term stability is likely. As consolidation accelerates across the industry, these insights help operators rationalize newly combined networks by deciding which acquired sites to keep, refresh or divest based on long-term viability. Retailers can adjust capital plans before conditions shift. Networks built with this foresight are better positioned to absorb volatility and stay competitive while others react to it.

Illustrating the ROI by positioning your network to lead in an electric future

A long-term network strategy depends on placing assets where they will produce reliable returns. Movement data provides the visibility needed to make those decisions with confidence. It shows how corridors perform today and where new demand is likely to appear, giving retailers a clearer view of long-term opportunity.

Make long-term investments more reliable through evidence

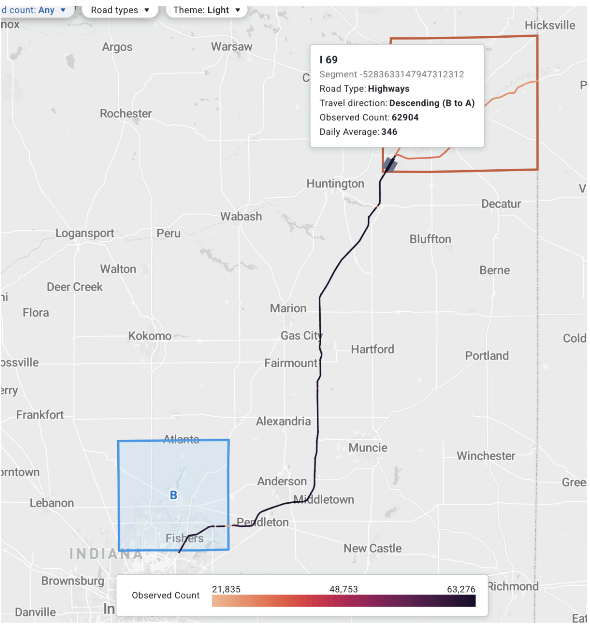
Major investments require certainty. Land, construction and equipment must hold value over many years, so a site placed on the wrong corridor creates lasting inefficiency. Commercial movement insights reduce that risk by revealing how commercial vehicles actually use a corridor before capital is committed. They show how traffic flows across the day, how often high-value fleets return and whether a location encourages drivers to stop or pass by.

This level of visibility helps retailers understand the revenue profile of a site before it enters the network. They can see whether demand follows a steady rhythm or depends on sporadic peaks. They can also compare multiple corridors to judge which offers more stable long-term potential. After launch, the same dataset provides a benchmark for evaluating performance, identifying early signs of strength or underperformance.

This creates a consistent, evidence-based approach to capital planning. Decisions become easier to defend because each one is tied to observable behavior rather than assumptions. Over time, this clarity strengthens financial discipline and supports a long-term growth strategy built on proven patterns.
Plan EV charging sites where demand will be strongest

Alternative fuels raise the stakes for site planning. Heavy-duty charging infrastructure requires significant capital, and its success depends on placing assets where commercial vehicles already operate. Commercial movement insights show where electrifiable fleets operate and which corridors align with the duty cycles suited for early charging adoption. These signals help retailers avoid missteps and focus investment on locations with dependable commercial activity.

Understanding these patterns allows retailers to evaluate not only where charging demand may appear, but how consistently it will show up. Corridors with strong freight presence and steady return behavior offer the highest likelihood of sustained utilization. This prevents stranded assets, including expensive chargers that sit idle during the early stages of market adoption.

Acting early creates a meaningful advantage. Once drivers find reliable charging on a corridor, they tend to build routes around it, creating a cycle of repeat visits that reinforces the value of the location. Competitors who enter later must convert drivers away from an established pattern, which is difficult once operational trust is in place.

Strategic placement today protects investment and positions the network for the next wave of commercial fueling. It keeps long-term decisions grounded in observable behavior rather than assumptions, ensuring that new assets support both current demand and the transition to future energy needs.


The future is observable

Fuel retail is entering a period of change, but the patterns that guide commercial movement remain steady and measurable. Operators who can see those patterns will make better decisions, move earlier than competitors and place assets where demand will endure. Commercial movement insights reveal where the market is headed, not just where it stands today, giving retailers a grounded way to plan for the next decade of fueling.

Networks built on observable truth gain an advantage that compounds. Each investment becomes more precise, each corridor choice becomes more defensible and each shift in the energy mix becomes easier to navigate. The retailers who lead will be the ones who treat data as the foundation of long-term growth, not a supporting tool.

To see more of the evidence behind these insights and how they apply across real corridors, download our Fueling Strategic Growth report here.

Frequently Asked Questions

They reveal the stable patterns that shape commercial demand, including where fleets travel, how often they return and which corridors anchor repeat activity. This helps retailers plan investments that hold value over many years rather than relying on short-term traffic data or intuition.

Structural demand shows the baseline volume created by freight and regulatory requirements, while frequency highlights how often those same customers return. Together, they create a foundation for forecasting volume, managing risk and aligning capital with the customers who drive the most revenue.

The same insights used to locate diesel demand today show where electrifiable fleets already operate. They identify corridors with strong commercial activity and consistent duty cycles, helping retailers place charging assets where utilization will be reliable as adoption grows.

A single movement dataset shows how demand behaves across diesel, electric and future energy types. This continuity allows retailers to evolve their networks without resetting their strategy. Each decision remains grounded in observable behavior, reducing risk as the market changes.

Recent news & releases