Skip to Main Content

How competitive analysis for fuel stations helps you win the corridor

Key Insights

  • Frontage (pass-by) data combined with county-level movement insights reveals whether a site is capturing its fair share of regional commercial traffic — or losing ground to nearby competitors.
  • Route-level analysis identifies underserved corridor stretches where proven truck demand exists but fueling infrastructure hasn’t kept pace, creating high-confidence investment targets.
  • Observed movement data turns competitive planning into a measurable financial model: stop counts, dwell time, and vehicle mix allow operators to forecast and verify ROI before and after each campaign or site change.

Fuel retail is a high-volume, low-margin business. On any given corridor, every gallon a competitor sells is one you do not. The competition is constant and small advantages in access, design, or visibility decide who captures the next truck that stops to refuel. Many strategies are still guided by intuition or other methods that only provide a part of the picture of how drivers behave.

Winning in this environment requires precision. Competitive analysis for fuel stations must rely on observed movement, not guesswork. With up-to-date, aggregated, anonymized commercial vehicle movement insights from the Altitude platform, operators can see where competitors are losing demand, identify which corridors hold untapped opportunity and act with confidence instead of assumption.

Understanding corridor performance through observed movement

Market share is won by knowing where volume exists and which sites capture it. Traditional metrics can show surface traffic, but they do not explain who stops, how often or why. The Altitude platform makes frontage (pass-by) metrics visible through observed commercial movement, allowing retailers to identify underperforming locations and underserved segments with precision. 

Effective competitive analysis for fuel stations depends on this clarity, turning corridor observation into actionable insight about which sites lead, which lag and where the next opportunity lies

Expand frontage analysis with regional-level insights

Frontage (pass-by) exposure gauges how much movement passes a location. It helps retailers understand visibility, access, and potential exposure along a corridor. Yet frontage measurement reflects only what happens directly in front of the site.

Adding regional (e.g., county-level) movement insight provides the broader context. Regional or county-level metrics show the total volume and composition of commercial journeys across the surrounding area. This helps operators see whether local frontage performance reflects the broader market. Together, they separate site effects from corridor conditions.

This relationship between county and frontage reflects complementary macro and micro views. County-level movement represents the macro view, showing the full extent of commercial activity within a region, while frontage captures the micro view of what occurs at a specific site. 

When analyzed together, they show how local performance aligns with the surrounding market and reveal whether a site is capturing its fair share of regional movement or falling behind nearby competitors.

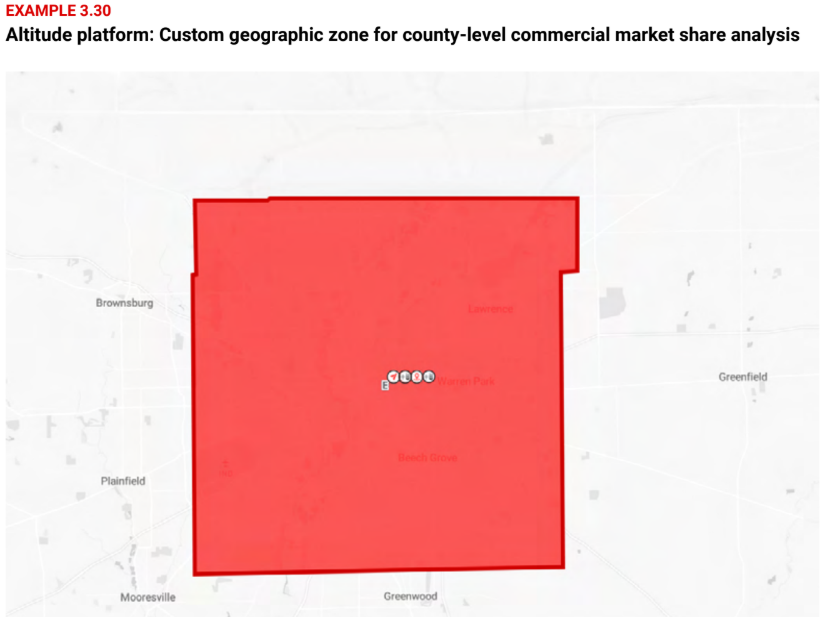
This screenshot from the Altitude platform shows a county-level zone used to measure overall commercial movement and establish a benchmark for site performance.

Use route-level insights to find underserved customers

Traffic along a corridor is rarely balanced. Some sections attract consistent stops and strong sales, while others see steady movement but limited places for drivers to refuel or rest. Route-level insights show where that imbalance exists by mapping how commercial vehicles actually travel, not just where they pass by.

Through this view, operators can see where high demand is already present but competitors are not meeting it. These underserved stretches often include heavy and vocational vehicle traffic without enough fueling capacity, parking or convenience access. They represent immediate potential for growth through marketing, acquisition or future site development.

In a recent industry study, an analysis of Highway I-69 recorded more than 62,000 observed commercial journeys within a defined period. With Altitude’s route-level insights, operators could pinpoint similar high-truck stretches lacking services and direct future investment or promotion to the areas with the most upside.

Identifying underserved segments helps operators expand intelligently. It directs investment to places where demand is proven but supply has not caught up, creating faster results without adding unnecessary competition.

Illustrating the return on investment

Winning along a corridor is not only about taking customers from competitors. It is about proving that each competitive move delivers measurable financial value. When observed movement guides decisions, operators can model potential outcomes before acting and verify results after implementation. 

Competitive analysis for fuel stations uses these same measures to evaluate strategy. It tracks stop counts, dwell times and post-campaign performance to confirm which changes truly shift market share.

Quantifying the impact of a targeted shift

Consider a corridor where a competitor’s site has strong visibility but limited access and tight parking. Frontage data shows high pass-by traffic but a low stop rate and route analysis confirms that commercial vehicles continue through without refueling. That weakness creates an opening for a nearby operator with better site circulation.

By promoting easier entry, faster fueling and available parking through a targeted campaign, the operator can redirect a small portion of those vehicles. Capturing even five to ten percent of that traffic can add meaningful volume. For a corridor that moves thousands of commercial vehicles a week, this shift could equal several thousand additional gallons sold and a lift in in-store transactions. Because these numbers are based on observed patterns rather than estimates, the return can be forecasted and tracked with precision.

This type of campaign transforms marketing from a broad message into a focused competitive action. Performance can be measured through follow-up data, comparing stop-ins and dwell time before and after the campaign to confirm whether redirected traffic translated into new sales.

A framework for precise investment

Insight-led planning turns competition into a measurable process. Each decision, from marketing to redesign, can be evaluated through the same framework that predicts financial return. By combining stop counts, vehicle mix and dwell behavior, operators can estimate how proposed changes will influence both fuel and in-store sales before committing resources.

This approach creates accountability and speed. Leadership teams can approve targeted spending with confidence because projections are based on observed movement rather than assumptions. Once a campaign or upgrade is complete, results can be tracked using the same indicators to confirm that the expected return was achieved.

When competitive planning follows this structure, every action is supported by data, measured through outcomes and tied directly to financial performance. It transforms corridor strategy from reactive competition into a deliberate investment model.

Growing through optimization

Not every competitive strategy requires new construction. In many cases, the fastest gains come from improving how existing sites operate. Corridor insights reveal where volume is being lost to access limitations, service gaps or timing mismatches that can be corrected without major investment.

By studying where vehicles pass but do not stop and when demand peaks across the day, operators can identify adjustments that deliver measurable returns. Extending early morning or overnight hours, refining traffic flow on site or promoting reliable parking and quick service can convert existing movement into additional sales. These changes are small but compound quickly when applied across a network.

The advantage of this approach is speed. Improvements can be tested in-market, measured through observed performance and scaled once results are proven. It allows operators to capture demand already present along the corridor while using the same footprint and resources more effectively.

Optimizing what exists reinforces a disciplined approach to competition. It focuses effort on real opportunity rather than expansion for its own sake, building profitability through precision and continuous improvement.


Compete smarter, grow stronger

Competition along major corridors will always be part of fuel retail. What separates strong operators is how they approach it. Success comes from clarity. It means understanding where opportunity exists, why it matters and how to act on it with precision.

Ground strategy in observed commercial movement to replace assumptions with measurable evidence. Corridor insights show where demand is building, which sites underperform and where small operational changes can produce meaningful returns. Each decision, whether a marketing campaign or an on-site adjustment, becomes part of a disciplined process that connects action to outcome.

This is what competitive analysis for fuel stations delivers in practice. It turns real-world movement into measurable insight that drives precise, confident decisions. By focusing on evidence instead of assumptions, operators shift from reacting to competitors to shaping their own advantage.

For more examples of this real-world evidence, download our Fueling Strategic Growth report here.

Frequently Asked Questions

Competitive analysis built on observed movement helps developers and investors understand how different locations perform in practice. It shows where demand is strongest, which corridors attract consistent activity, and where market gaps exist — supporting more confident site selection and investment decisions.

By studying where commercial vehicles stop, how long they stay, and which nearby sites they choose, operators can see where competitors are losing ground. This understanding highlights opportunities to improve access, amenities, or marketing and turn location performance into a measurable advantage.

County-level insights show total commercial movement across a region, while frontage focuses on traffic immediately in front of a site. Viewed together, they reveal whether a location is capturing its fair share of the broader market or underperforming against nearby corridors.

Route analysis highlights stretches of highway with high truck movement but limited fueling or rest options. These underserved segments are prime candidates for investment, marketing, or future builds because demand is already proven but supply hasn’t caught up.

Recent news & releases