A planner’s checklist: What telematics data can (and can’t) do for freight planning
Telematics data for freight planning complements traditional sources. Our checklists share what telematics data can and can’t do to support freight planning.

Our Curb to Corridor blog series delivers a data-driven framework at every scale.
From last-mile to regional to long-haul, these insights propel your freight story forward.
Learn more in our recent blogs.
It’s official: Lionel Messi causes more harsh braking events than his arch-rival Cristiano Ronaldo. Comparing traffic behavior in cities where both the Argentinian (Messi) and Portuguese (Ronaldo) national teams played during June, our event freight planning analysis found that on game days the cities hosting Argentina’s matches saw a stronger impact on commercial traffic.
Of course, there’s more to the story than team rivalries. We found that some soccer cities simply score better than others at managing commercial traffic during game days. Here’s what our analysis uncovered.
Altitude measures “harsh braking” using threshold-based rules. First, we calculate the rate of change of the vehicle deceleration. If that rate of change in deceleration exceeds the set threshold for the event type, a harsh event is registered.
Measuring braking and other harsh events (which can include acceleration and cornering) allows us to measure risks to drivers, vehicles and roadways.
Normally, sporting events happen during nights and weekends, so they don’t have much impact on commercial traffic during those off-peak travel hours. But many of this summer’s world soccer games are played during the week, some during business and commuter hours, offering a unique opportunity to understand a big event’s impact on freight traffic and commercial deliveries in multiple US cities.
For the game-day cities, we measured the percentage of game-day increase in harsh braking events for a five-kilometer radius around the stadium. We compared that to a normal workday. The two cities where Messi played saw a spike in harsh braking of 650% and 350% during game days.
On June 27 in Arlington, Texas:
On June 16 in Kansas City, Missouri:
More congestion and slamming on the brakes along crowded roadways add up to riskier driving conditions during these game days.
Meanwhile, in Houston, Portugal’s game days only scored a 166% and 59% increase in harsh braking.
On June 17 in Houston, Texas:
On June 23 in Houston, Texas:
Although traffic in Houston slowed down just as it did in Arlington and Kansas City, Houston did not see the same correspondingly high bump in harsh braking events. Perhaps this was because Houston saw a smaller increase in traffic volume as compared to Arlington and Kansas City.
We compared the changes in traffic volume and harsh braking to look for a potential correlation.
Given the big difference in the traffic volume rise for each city, we wondered if that was the connecting factor for more harsh braking. To check, we looked at the traffic volume in cities with the biggest increase in hash braking.
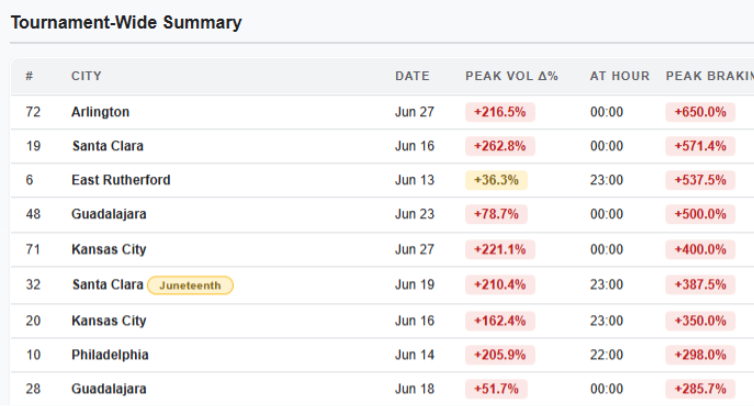
We were surprised that not all cities with high levels of harsh braking had a correspondingly high bump in traffic volume. East Rutherford, New Jersey, most notably, had a harsh braking increase even when volume was low. Our conclusion is that harsh braking can show up even without a huge bump in traffic volume.
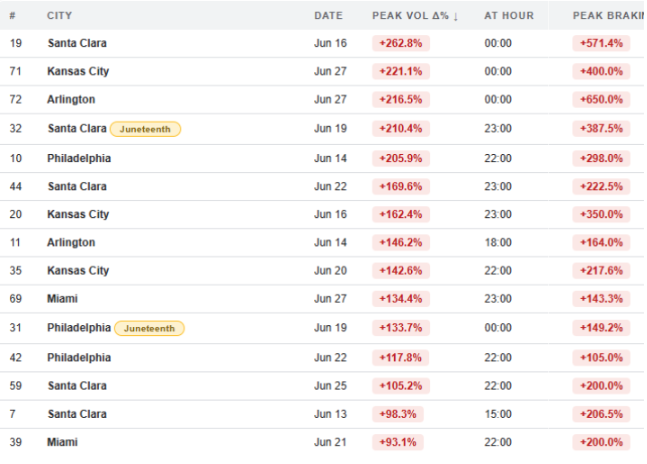
We then ranked the cities by their increase in traffic volume and found an inverse correlation: No city had a jump in traffic volume without also seeing a rise in harsh braking. Although harsh braking events can pop up independent of congestion, a rise in weekday traffic does drive more harsh braking.
Our analysis can help planners anticipate and mitigate risk for large weekday events. Given the correlation between traffic volume and harsh braking, planners can identify and publicize alternate routes for commercial traffic. Moving freight to other corridors can free the main routes for event traffic, keeping both routes safer.
Leaning into data-powered planning can keep your team’s freight moving safely, even if Lionel Messi comes to town.
Get the full analysis and compare traffic in the host cities for this summer’s soccer games. Visit the dashboard to see all the stats.
Harsh braking is measured using threshold-based rules that calculate the rate of change of vehicle deceleration—when that rate exceeds a set threshold, a harsh braking event is registered, signaling increased risk to drivers, vehicles, and roadways.
Not always—while every city with a jump in traffic volume also saw a rise in harsh braking, some cities (like East Rutherford, NJ) experienced harsh braking spikes even with relatively low traffic volume, showing congestion isn’t the only factor at play.
By identifying and publicizing alternate routes for commercial traffic, planners can shift freight away from congested event corridors, reducing harsh braking risk and keeping both freight and event traffic moving more safely.
Telematics data for freight planning complements traditional sources. Our checklists share what telematics data can and can’t do to support freight planning.
New data sources for MPO freight planning: 3 overlooked metrics that reveal regional trends before they hit your dashboard.
State DOTs can forecast truck traffic earlier by watching freight metrics from city and port data. Here are 3 signals worth tracking.