
Curb to corridor: How Arizona models last-mile delivery behavior
Our Arizona case study illustrates how to capture true last-mile delivery behavior to inform infrastructure wear and tear, safety, curbside management, and more.

With advancements in technology, our roads and vehicles are reaching new heights of intelligence and safety. Yet an often overlooked aspect merits closer examination: The critical dynamics behind every sharp turn, sudden stop or rapid acceleration. These incidents, known as harsh events, are more than mere driving reactions; they offer insights into driving behavior and their impact on road safety.
Have you ever wondered what driving habits say about overall road and highway safety? Understanding harsh events—sudden actions like sharp braking or abrupt turns—is key to uncovering safety insights. These moments offer vital data, shedding light on how drivers and vehicles respond to the road and pointing the way to safer, smarter driving.
Harsh events provide critical insights into driving behaviors by detecting sudden changes in vehicle movement. In the Altitude platform, our Harsh Events capability leverages commercial vehicle mobility data, not just GPS, to analyze harsh braking, acceleration and cornering at a granular, road-segment level.
As the primary source and processor of this data, we apply advanced processing pipelines to detect when vehicle movements exceed set thresholds, maintaining greater accuracy and context. This includes segmentation by vehicle type, class, vocation and industry, offering insights unavailable on other platforms.
These allow for precise detection that helps transportation planners and safety agencies identify high-risk areas and improve road safety initiatives.
The Altitude platform identifies and categorizes harsh driving events. It provides detection and analysis of various driving risks by leveraging GPS data and providing comprehensive API capabilities.
Harsh events are categorized into three main types:
Harsh events are identified in our platform using GPS data and commercial transportation insights to measure how quickly a vehicle accelerates or decelerates. When this rate of change exceeds a specific threshold, a harsh event is recorded. These insights enable you to better assess the risks linked to highways and regional safety as a whole.
The platform accurately detects and classifies harsh events by privatizing, aggregating and then analyzing these insights. Its API gives you the ability to study all three types of harsh events down to the road segment level. Users can filter these findings based on vocation, industry and vehicle class to gain detailed insights for more tailored safety strategies that improve overall highway and road network safety.
Analyzing harsh event data helps transportation planners improve highway safety by identifying dangerous driving behaviors and high-risk road segments. These insights enable you to develop targeted policies and infrastructure improvements, such as stricter enforcement in high-risk areas, driver awareness campaigns, optimized traffic signals and enhanced route planning. Quick responses to detected patterns, improved traffic flow and redesigned intersections or curves contribute to fewer collisions and safer roads.
Transportation planners can identify and address various highway safety concerns by examining specific types of harsh events. Here are five key examples of how the Harsh Events capability can be used:
Before a warehouse facility opens, trucks typically want to try to be among first in line for staging. This enables them to get on the road quicker and make faster progress toward their destinations. Mobility insights can help outline the entire process, from staging to where commercial vehicles are frequently headed, showing how drayage trucks typically move product. Transportation analytics provide vital insight into how supply chains disperse out from central ports or distribution centers and snake throughout a region. Warehousing and logistics companies can use insights like these to identify staging and parking inefficiencies and develop effective solutions for them.
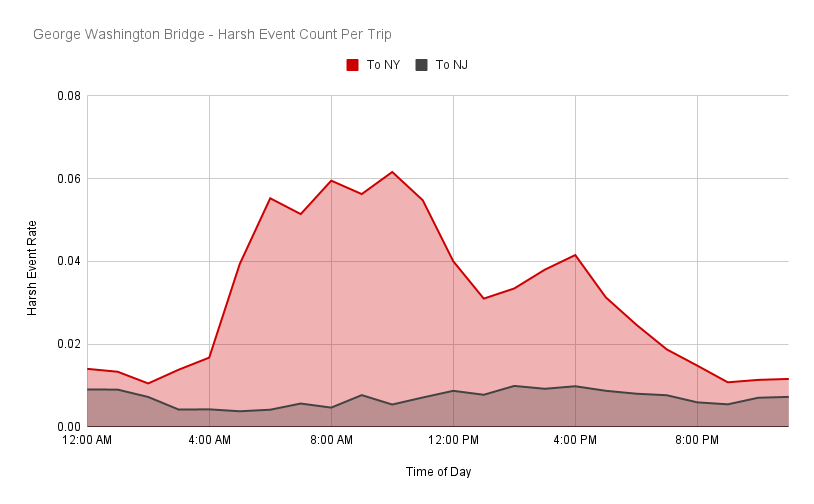
Example: An analysis of the George Washington Bridge conducted with Altitude’s Harsh Events insights during severe winter weather conditions. This snapshot shows how dangerous driving events trended during peak times. Read “Bridging the Data Gap: Commercial Freight Insights from Five Key U.S. Bridges” to learn more.

Example: Harsh driving patterns observed along Interstate 90 in upstate New York during strong winter storms (compared to baseline numbers). Read “The Road to Recovery: Transportation Insights for Understanding and Rebuilding After Extreme Weather” for more Harsh Events insights.
Altitude’s Harsh Events API, with its ability to distinguish harsh driving events by vehicle class or vocation, offers significant advantages:
This comprehensive approach makes the API invaluable for enhancing road safety, fleet management and sustainable transportation planning.
The Altitude platform and the Harsh Events API provide transportation and urban planners and safety officials with powerful tools to bolster road safety proactively. Planners can implement targeted interventions and improve road safety by leveraging granular insights into harsh braking, acceleration and cornering events.
Harsh events data allows for detailed monitoring and analysis of driving behaviors across road segments, vehicle classes and vocations. For example, transportation officials can use these insights to identify specific highway stretches where truck drivers frequently use harsh braking. This insight might lead to installing improved signage, adjustments to speed limits or targeted education campaigns for commercial drivers in that area.
By pinpointing high-risk areas precisely, planners can allocate resources more effectively, focusing on the segments needing attention. This data-driven approach fuels safety interventions tailored to address each location’s issues.
The Harsh Events API lets planners analyze the relationships between harsh driving events and actual incidents. For instance, your organization might discover a strong correlation between frequent harsh cornering events and increased collisions at a particular intersection.
By understanding these correlations, officials can predict potential collision hotspots and implement preventive measures. These could involve redesigning problematic intersections, adjusting traffic signal timing or implementing driver awareness campaigns focused on safe cornering techniques in high-risk areas.
Transportation planners can develop sophisticated predictive models by leveraging historical data on harsh driving events and their outcomes. These models can help forecast potential safety issues before they result in incidents.
For example, if a predictive model identifies an emerging pattern of increased harsh acceleration events in a residential area, planners might proactively implement traffic calming measures, such as speed bumps or narrowed lanes. This forward-thinking approach allows officials to address safety concerns before they escalate into more serious problems.
Harsh event insights can be integrated into comprehensive transportation management systems, supporting holistic safety improvements that align with broader goals like environmental sustainability and operational efficiency.
For instance, planners might use harsh braking to identify areas where improved traffic flow could reduce stop-and-go traffic, enhancing safety and reducing emissions. Or, they could use harsh acceleration to optimize the placement of electric vehicle charging stations, encouraging smoother driving patterns while supporting the transition to cleaner, more cost-efficient transportation.
By incorporating these detailed safety insights into wider planning initiatives, transportation officials can create synergies between safety improvements and other urban development goals, leading to more resilient and livable communities.
Altitude’s Harsh Events API provides a powerful toolkit for proactive highway safety management. By harnessing these insights, you can make data-driven decisions that help enhance safety and contribute to more efficient, sustainable and user-friendly transportation networks.
Vision Zero, an ambitious initiative to eliminate traffic fatalities and severe injuries, is transforming road safety worldwide. This approach believes that road collisions are preventable, not inevitable. By using smart design, education and enforcement, cities engaged in this initiative aim to make their streets safe for everyone.
The Harsh Events API from Altitude helps make Vision Zero a reality. City planners can use these insights to spot risky areas and improve road safety. They can create smarter plans for safer streets and highways with better data. As we strive towards a future with zero traffic-related fatalities, leveraging such advanced analytics will be key to implementing targeted interventions and realizing the Vision Zero mission.
Harsh events provide invaluable insights into driving behaviors and road safety, offering a powerful tool for transportation planners and safety officials. We can create more targeted interventions, predictive models and comprehensive safety strategies by leveraging this information through platforms like Altitude’s Harsh Events API. As we move toward a Vision Zero future, the intelligent use of transportation analytics will be crucial in shaping safer, more efficient and sustainable road networks for all.
Reach out to us to learn more about our Harsh Events API.
Our Arizona case study illustrates how to capture true last-mile delivery behavior to inform infrastructure wear and tear, safety, curbside management, and more.
This heavy-duty truck volume analysis shows how toll pricing differences reshape freight corridor behavior at the US-Canada border.
This heavy-duty truck volume analysis shows how toll pricing differences reshape freight corridor behavior at the US-Canada border.