Freight route planning for events: Soccer cities with the best traffic stats
See how freight route planning for weekday events can cut harsh braking risk. Real traffic data from Leo Messi and Cristiano Ronaldo’s June games reveals why.

A strike that threatened to close dozens of ports along the Eastern and Gulf coasts of the United States during some of the busiest months of the year ended on Friday, October 6 after only three days. The International Longshoremen’s Association, a union representing about 50,000 port workers, agreed to a contract extension through mid-January 2025. Port workers had been seeking higher wages and job security in the face of automation. A strike of this magnitude had not been seen in over 30 years. The temporary settlement will allow port operations to continue as normal while a new contract is negotiated.
To further understand the impact of the three-day strike and the potential ramifications of a larger strike in the future, we used our Altitude platform to quantify change in commercial vehicle activity at three different ports. We explored normal vehicle operations at these ports, how the ports were impacted over the three days of the strike and what types of commodities flow through these ports. Future work from the Altitude by Geotab team will investigate the amount of time it took for each port to resume normal operations after the strike and survey the consequences of a larger strike if a long-term agreement is not reached in January
We examined commercial vehicle operations at the Port of New York/New Jersey, the Port of Houston, and the Port of Savannah. Daily truck activity to each port during October 2023 is shown in the table below. The three-day strike lowered daily truck counts by 85-95%.
| PORT | DAILY* NUMBER OF TRUCKS |
|---|---|
| New York/New Jersey | 16,000 – 26,000 |
| Houston | 6,500 – 13,000 |
| Savannah | 5,400 – 8,600 |
*average weekday in October 2023
The primary industry associated with port-related commercial vehicle movement at all three ports is transportation and warehousing (which accounts for 60-65% of the primary industries associated with trucks visiting the ports).
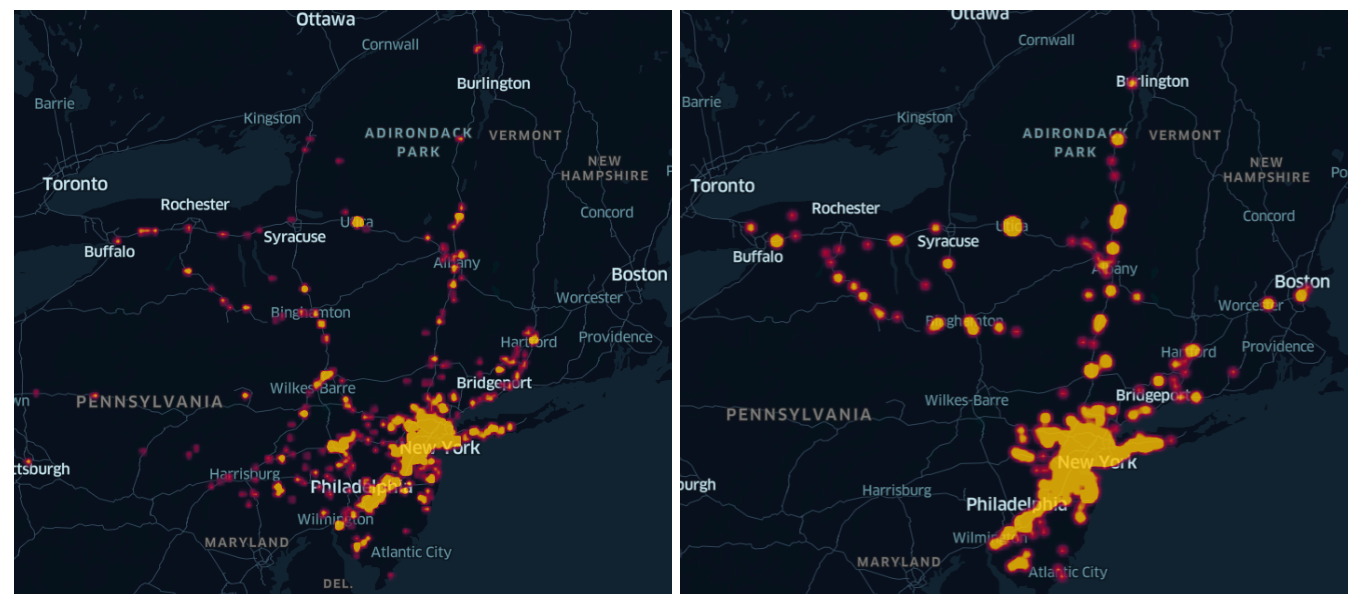
The heatmaps above show commonly frequented origins (left) and destinations (right) for trucks visiting the Port of New York and New Jersey. These maps illustrate that commodities from the port are transported around the larger New York region (including to other metro areas such as Philadelphia and Boston).
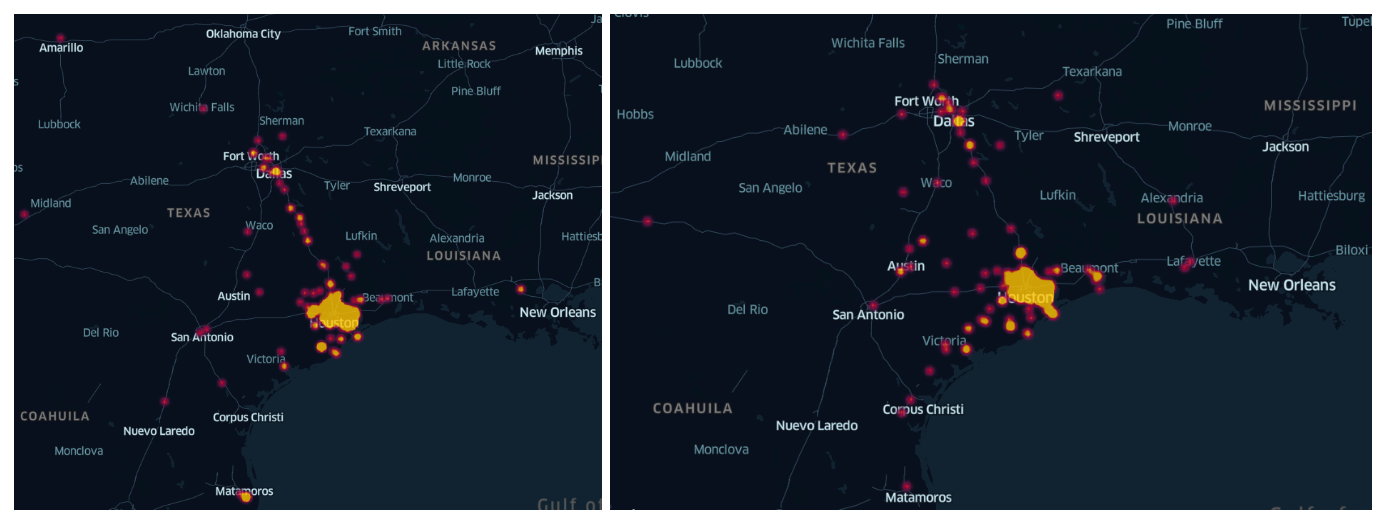
The heatmaps above show commonly frequented origins (left) and destinations (right) for trucks visiting the Port of Houston. Many commercial vehicles visit the Dallas/Fort Worth region before and after going to the port.
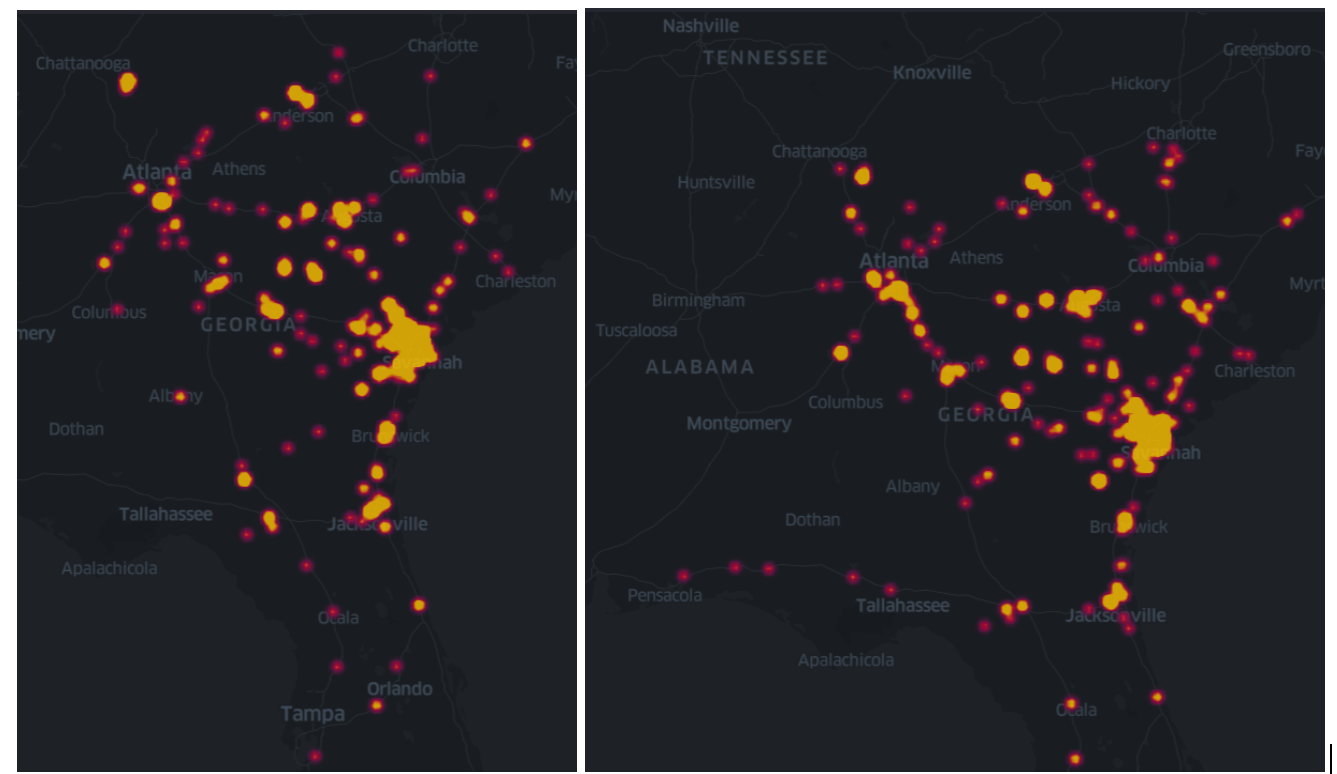
The heatmaps above show commonly frequented origins (left) and destinations (right) for trucks visiting the Port of Savannah. In comparison to the other two ports analyzed here, vehicles visiting the port of Savannah are more evenly distributed around the port, going as far as western Florida.
In using route analytics to identify potential disruptions’ effects on commercial vehicle activity, planners and policymakers can devise strategies to make supply chains more resilient. Supply chain optimization can take the form of building new roads or infrastructure to provide a wider range of alternative routes if a key thoroughfare is impinged. Alternatively, traffic-calming policies can help make supply chains more resistant to disruptions by keeping roads more traversable and less congested. Altitude by Geotab will continue to conduct research into how long it took for normal operations to resume at these ports and forecast the potential results of a larger-scale workers’ strike.
Interested in learning more about our transportation data and how it can help you develop effective supply chain optimization plans? Speak to one of our experts today.
See how freight route planning for weekday events can cut harsh braking risk. Real traffic data from Leo Messi and Cristiano Ronaldo’s June games reveals why.
Toll changes at the US-Canada border shifted truck traffic — and revealed the hidden freight congestion impact on delivery times, penalties and regional economic health.
Our Arizona case study illustrates how to capture true last-mile delivery behavior to inform infrastructure wear and tear, safety, curbside management, and more.