Freight route planning for events: Soccer cities with the best traffic stats
See how freight route planning for weekday events can cut harsh braking risk. Real traffic data from Leo Messi and Cristiano Ronaldo’s June games reveals why.


When a project specifically involves truck and freight infrastructure, you need commercial vehicle Annual Average Daily Traffic (AADT) to support federal counts. Commercial vehicle AADT fills in details planners may miss — for example, on corridors where no cameras or even counters exist. Commercial AADT reveals whether those miles traveled are from passenger vehicles or Class 8 long-haul trucks.
This latest version of our model includes updates that better support planners with reliable commercial-vehicle data: Direct vehicle-class modeling, calibrated prediction intervals on every estimate and directional AADT ready in 90 days instead of 12–24 months. Tested and proven, here is how our model provides commercial AADT to support planning, grant applications and more.
Altitude by Geotab is the only commercially available AADT product that provides segment-level estimates for Heavy and Medium commercial vehicles alongside universal traffic, covering approximately 10 million road segments across all 50 U.S. states, D.C., and Puerto Rico.
Surprisingly, there really is no benchmark for truck-specific AADT from existing sources. For example, there are no Federal Highway Administration (FHWA) accuracy standards for vehicle-class-specific AADT. The existing AADT benchmarks apply exclusively to total traffic volume, not broken out by vehicle class, type or vocation.
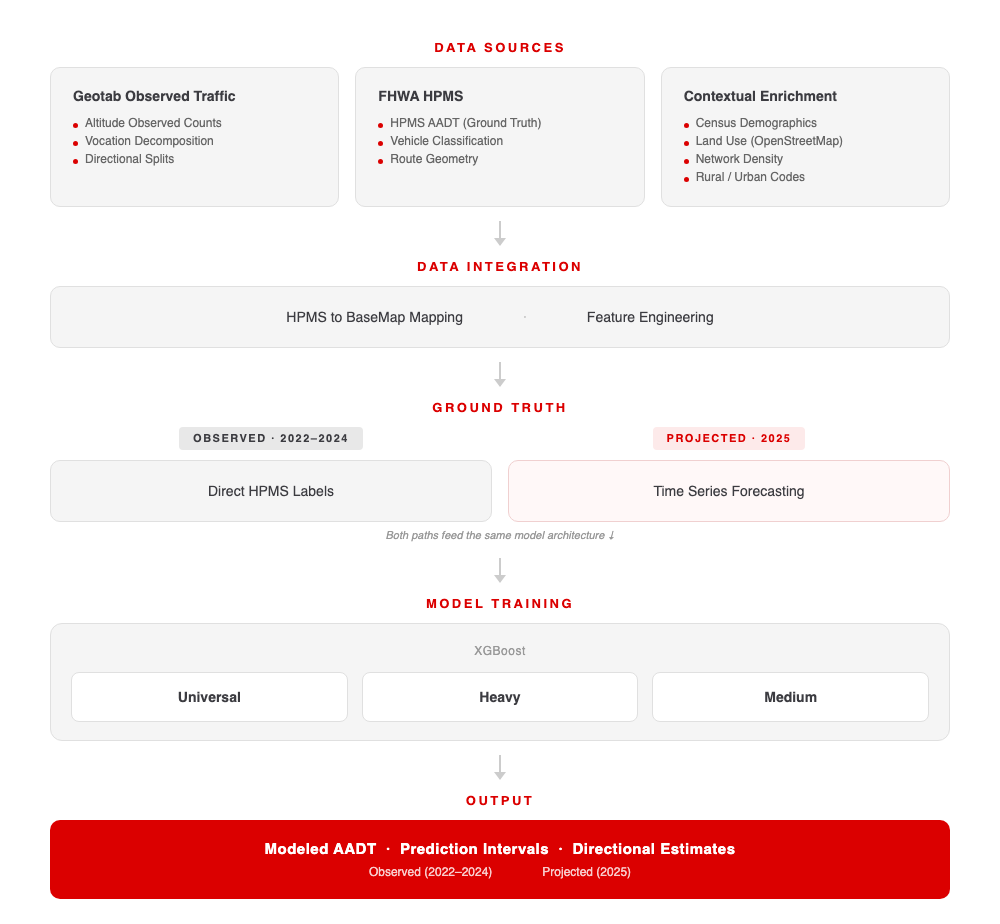
Altitude fills that gap. Truck-specific AADT is critical for freight corridor planning, bridge loading assessments and pavement design. The latest version of Altitude’s commercial vehicle AADT model introduces four substantive advances over previous approaches.
Altitude’s commercial vehicle AADT uses two complementary modeling approaches to create estimates across both observed and projected years.
Our model leverages volume and geospatial data from both the Federal Highway Administration (FHWA) and Geotab’s Altitude platform. Additional supporting data sources include census socioeconomic data, land use classifications and road network density features to enhance AADT modeling.
This model significantly improves data reliability, particularly on secondary roads where standard matching parameters produce poor alignment. This improvement in ground truth quality is the single largest accuracy driver in our data integration pipeline.
Not surprisingly, due to lower sample sizes, published research on other truck-specific AADT estimates show substantially higher error rates than total-vehicle estimation. Examples include:
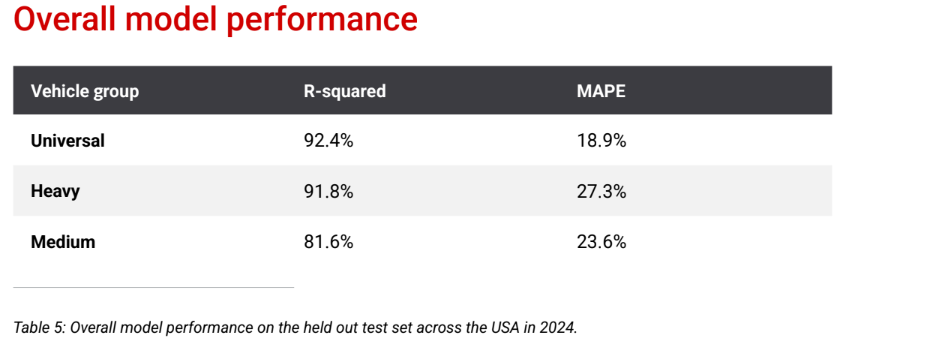
By contrast, Altitude achieves a MAPE of only 27.3% for heavy-duty trucks and a MAPE of 23.6% for medium-duty.
Building our commercial vehicle AADT model relies on three inputs:
Pairing Geotab’s high spatial resolution commercial traffic data with HPMS AADT strengthens our AADT model. By learning the relationship between these two data streams, the model produces segment-level estimates with a level of granularity, coverage and accuracy that neither data source could achieve independently.
The result is AADT data that’s ready to use: structured outputs with explicit confidence bounds, directional resolution, a documented quality standard and national coverage that is delivered within 90 days of year end. For planners who have been working with estimates and 12–24 month data lags, that timing can make the difference between a meaningful traffic plan and one that’s already outdated.
For more details, get our commercial vehicle AADT white paper, Full-Network Traffic Volume Estimation: Altitude AADT Modeling Methodology
Standard Annual Average Daily Traffic (AADT)measures total traffic volume across all vehicle types. Commercial vehicle AADT breaks that down by vehicle class — isolating trucks and freight vehicles specifically — which is essential for infrastructure planning decisions that depend on load and volume by vehicle type.
No. FHWA accuracy benchmarks apply only to total traffic volume, not vehicle-class-specific estimates. That means there’s no official bar for how accurate commercial vehicle AADT needs to be — which makes choosing a reliable provider all the more important.
Altitude achieves a mean absolute percentage error (MAPE) of 27.3% for heavy-duty trucks and 23.6% for medium-duty — significantly lower than the 41–96% error rates documented in published research on competing approaches.
The model is trained on segments where HPMS ground truth exists, learns the relationship between Geotab’s observed fleet GPS data and official counts, then applies that relationship across the full road network — including segments that have never had a counter or camera installed.
It supports a range of planning and infrastructure applications including freight corridor analysis, bridge load assessments, pavement design and federal grant applications where defensible, class-specific traffic data is required.
See how freight route planning for weekday events can cut harsh braking risk. Real traffic data from Leo Messi and Cristiano Ronaldo’s June games reveals why.
Toll changes at the US-Canada border shifted truck traffic — and revealed the hidden freight congestion impact on delivery times, penalties and regional economic health.
Our Arizona case study illustrates how to capture true last-mile delivery behavior to inform infrastructure wear and tear, safety, curbside management, and more.