A planner’s checklist: What telematics data can (and can’t) do for freight planning
Telematics data for freight planning complements traditional sources. Our checklists share what telematics data can and can’t do to support freight planning.


Our Curb to Corridor blog series delivers a data-driven framework at every scale.
From last-mile to regional to long-haul, these insights propel your freight story forward.
Learn more in our recent blogs.
What does congestion cost your region’s economy? Being able to quantify freight congestion’s impact converts corridor-level congestion data into tangible freight delay metrics. That data can reveal the potential for delivery penalties, which halt economic development.
Case in point: We recently analyzed a freight transportation shift at the US-Canadian border. Our findings illuminate how toll road pricing changed travel demand along a key corridor, the resulting change in congestion and how that shift can slow commerce.
There are two high-use toll bridges at the US-Canadian border where Ontario meets Michigan. The Ambassador bridge lies to the south connecting Windsor to Detroit. About 65 miles to the northeast, the Blue Water Bridge (BWB) connects the US and Canada at the city of Sarnia, which lies at Lake Huron’s southern tip.
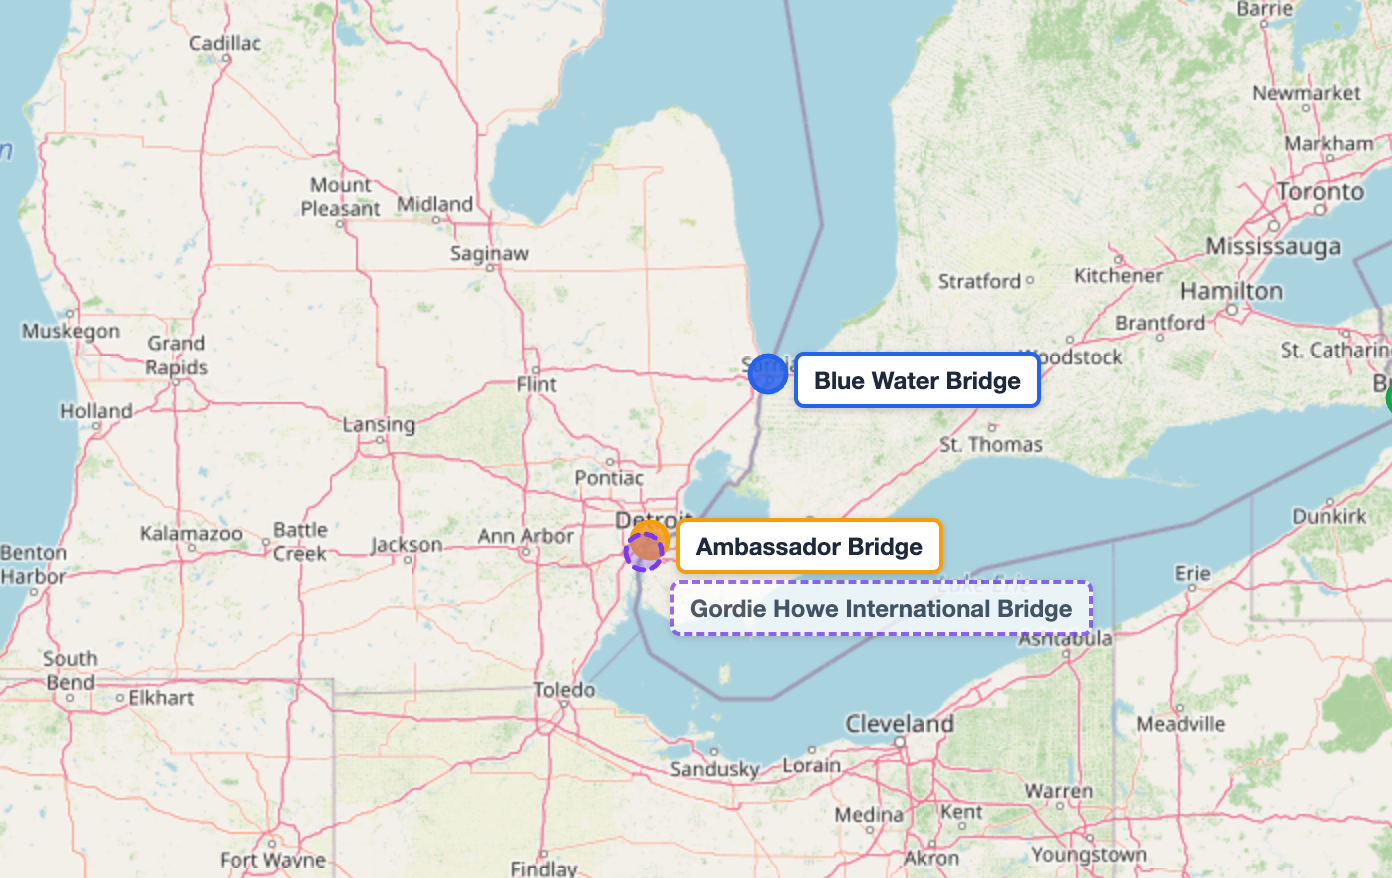
The Ambassador, on the more southern route, has historically seen more commercial traffic. But in January 2025, the Ambassador raised commercial toll prices from $8 to $9 US ($11 to $12 CAD). That’s when travel shifted north.
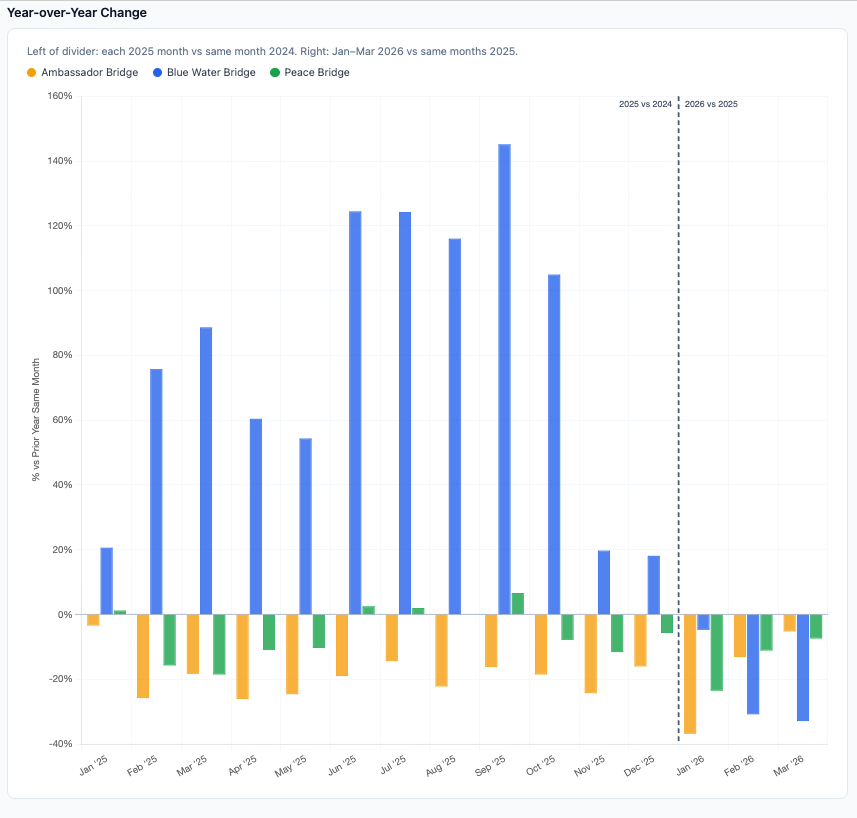
Using Altitude’s Origin & Destination metrics, we analyzed monthly heavy-duty truck trips from January 2024 through early 2026 on both bridges. We found that from Q1 2024 to Q1 2026, Ambassador traffic dropped from about 22,500 heavy-duty trips per month to only around 15,200. That’s a 32% decrease.
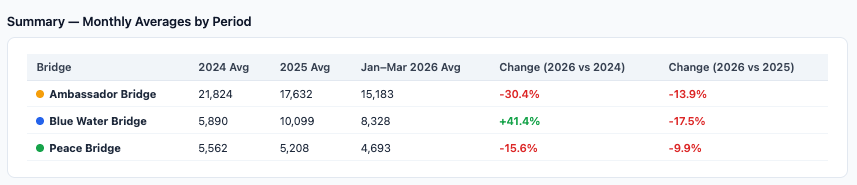
During the same period, truck travel on the BWB rose from about 6,900 to 8,300 trips per month — a 21% jump. Each truck also started making on average one extra crossing per month, creating a 28% rise in trips per vehicle. The biggest surge happened in January 2025, right after the Ambassador toll increase.
Meanwhile, further south on the Ambassador, the number of unique vehicles and trips per vehicle both dropped by about 10%.
Altitude’s role in the project was to provide data for calibrating and validating the models. Our commercial transportation analytics uses real operational data from more than six million connected commercial vehicles. Because we are able to classify those vehicle movements by vehicle vocation, or use, the data can isolate last-mile activity from other types of commercial travel, including long-haul, regional and hub-and-spoke.
Not surprisingly, the rising travel demand on the BWB had a measurable impact, which Altitude’s commercial vehicle analytics were able to capture.
We analyzed approach roads in zones within a radius of one mile, three miles, and five miles of the bridge entrance on both sides. Traffic slowed by 10-14% during the morning commute on roads approaching the bridge. Even motorways within a mile of the bridge, not necessarily connecting, slowed by 10%.
The bridge itself is only 1.2 miles, but typically can take up to half an hour to cross with border control inspections. Let’s assume it normally takes a truck about eight minutes to travel the five miles leading up to the bridge (at 50 miles per hour). Add the same time delay to driving on the bridge itself, and a 10-14% increase adds 4.5 to 5.5 minutes to the crossing.
Five minutes may seem like a minor delay, but being able to measure it, and any changes, is invaluable. What the Ambassador Bridge and BWB teach us is how to analyze the actual costs and savings related to congestion.
For example, a few minutes slower may not sound high-risk, but that time cost can grow. Consider the added time if drivers go out of their way, driving 64+ miles from the Ambassador Bridge crossing, for the BWB’s lower tolls. That detour costs valuable time, and growing congestion closer to the bridge adds to it.
Delays like this can quickly become geometric, compounding and expanding unpredictably as traffic slows along the way.
This increases two critical risks:
Instead, when planners can identify time delays in advance, they can work to shift commercial travel to less-congested corridors and minimize time overages.
The takeaway: What looks like a clear opportunity to save a few dollars in tolls can have far bigger costs in potential delays. Planners should understand the interconnected impacts that toll road and congestion mitigation changes can have on economic health in their regions.
Learn more about studying movements between standard zones, custom zones or road segments with Altitude’s Origin & Destination analytics.
When toll prices rise on one route, commercial carriers quickly shift to alternate crossings to protect margins. Altitude’s analysis of the US-Canada border shows this rebalancing can happen within a single month, redistributing thousands of truck trips and creating new congestion patterns on previously lighter-traffic corridors.
By analyzing vehicle speed and trip frequency across concentric zones around a crossing — at one, three and five miles — you can quantify how far congestion radiates and calculate added travel time per vehicle. Even a 10–14% speed reduction translates to measurable delay costs that compound across a fleet.
Congestion data lets planners connect travel time increases to delivery penalty risk, which directly affects business investment and supply chain reliability in a region. When planners can identify which corridors are absorbing diverted traffic, they can intervene earlier, through infrastructure, pricing policy, or routing guidance, before delays become economically damaging.
Telematics data for freight planning complements traditional sources. Our checklists share what telematics data can and can’t do to support freight planning.
New data sources for MPO freight planning: 3 overlooked metrics that reveal regional trends before they hit your dashboard.
State DOTs can forecast truck traffic earlier by watching freight metrics from city and port data. Here are 3 signals worth tracking.