Freight route planning for events: Soccer cities with the best traffic stats
See how freight route planning for weekday events can cut harsh braking risk. Real traffic data from Leo Messi and Cristiano Ronaldo’s June games reveals why.

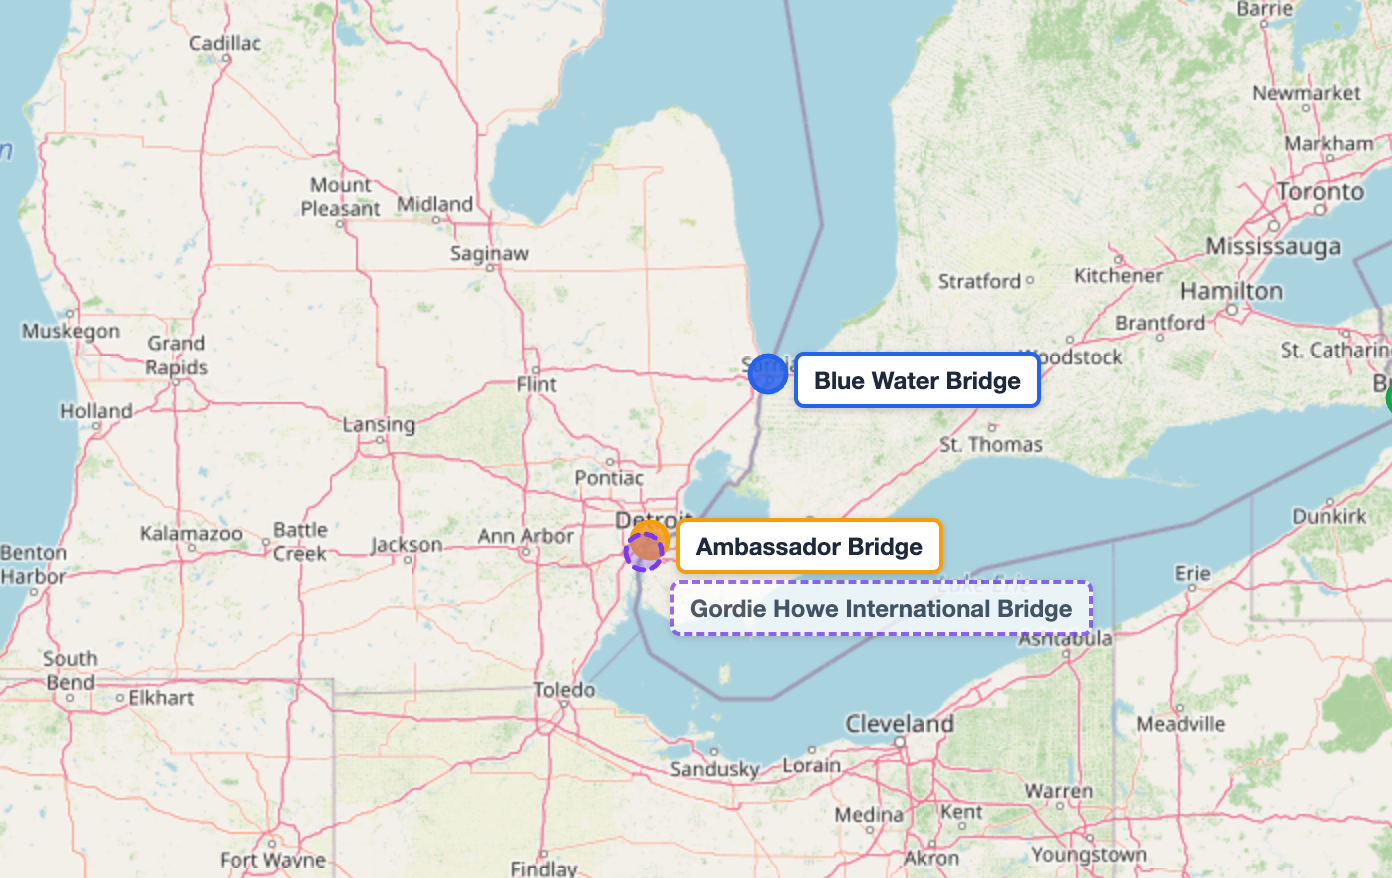
The Blue Water Bridge (BWB) has overtaken the Ambassador Bridge, as the busiest commercial crossing on the US-Canada border — approximately 2.1M commercial truck trips on the BWB vs. 1.9M on the Ambassador in 2025, according to the Bridge and Tunnel Operators Association.
For a moment it looked like traffic could shift back when Ambassador announced lower toll rates in April of 2026. But it turned out that the lower rates applied to passenger vehicles only, and the cheaper BWB kept the lead in commercial crossings.
The cause has already been widely reported: lower toll pricing on the BWB vs. the Ambassador Bridge. So we already know that trucks moved north to the BWB. But what we wanted to explore is what happened next, and why a toll road shift in demand matters for fleet operators.
Altitude’s aggregate commercial vehicle data lets us analyze the details.
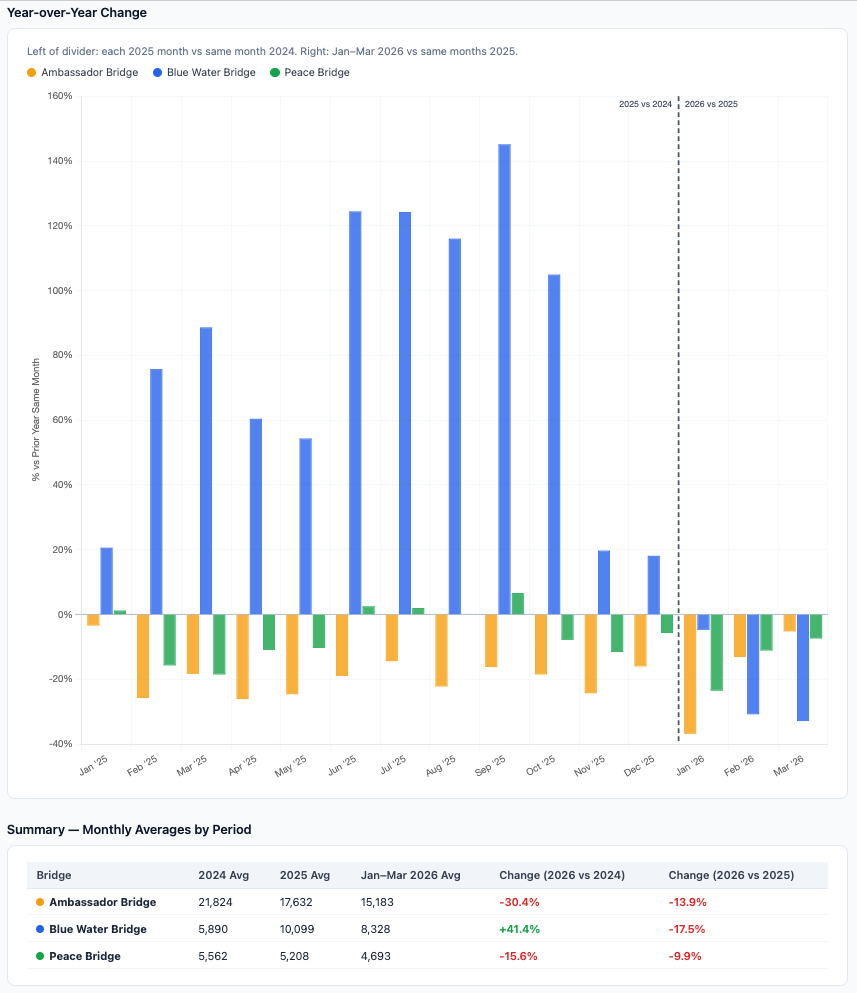
To start off, we wanted to validate the traffic shift after the January 1, 2025 toll increase on the Ambassador Bridge. Altitude captures approximately 5–15% of total truck volume on these bridges across these three crossings — a meaningful sample of fleet-tracked commercial vehicles, though not a complete picture of all traffic.
Looking at monthly heavy-duty truck trips from January 2024 through early 2026, the shift is clear. The Ambassador Bridge declined steadily from an average of roughly 22,500 HD trips per month in Q1 2024 to around 15,200 by Q1 2026 — a 32% drop. Over the same period, the Blue Water Bridge grew from roughly 6,900 to 8,300 trips per month, up 21%. The inflection point is visible: volumes at BWB surged sharply beginning in January 2025, coinciding with a significant toll increase on the Ambassador Bridge that took effect January 1, 2025.
Once confirmed, we moved to studying what’s underneath that trend.
It would be easy to assume that the traffic shift means more fleets switched bridges, but that turns out to be wrong. The BWB didn’t get a wave of new users, it just got more trips from the ones it already had.
What the data shows is that the number of unique trucks on the BWB stayed nearly flat, while the average number of trips per vehicle rose by a remarkable 28%. Trucks are essentially making one extra crossing – from 4.4 to 5.6 per month.
Meanwhile, on the Ambassador Bridge, the number of unique vehicles and trips per vehicle both dropped by about 10%.
Our interpretation: Fleets that were already using the BWB started running it harder. Our hypothesis is that the toll savings per trip are making more frequent crossings economical for existing BWB users, not pulling entirely new operators away from Ambassador.
Operationally, this is a routing-frequency shift, not a full corridor realignment. Many fleets appear to be using BWB for high-frequency runs and potentially still using Ambassador for others.
With the BWB volume increase, it is now absorbing increased crossing demand. This creates a resulting decrease in travel speeds which can lead to bottlenecks.
We looked at approach roads in zones with a radius of one mile, three miles, and five miles, finding that morning approach speeds to the BWB fell by 10–14%. Motorway speeds within one mile of the bridge are down by 10% in the morning hours.
What this means is that although the toll savings are real, so is the time cost. The cost-benefit calculation at BWB is shifting. What looks like a clear cost savings is becoming a more nuanced calculation as congestion builds. Operators with time-sensitive loads should measure toll savings against the risk of morning delays.
When the Gordie Howe International Bridge opens, that will create a new three-bridge dynamic for the Ontario-Michigan crossing. With planned commercial tolls of about $8.75 USD per axle, Gordie Howe pricing is positioned in between the BWB and Ambassador Bridge.
We plan to track toll changes in real time as this dynamic unfolds. Our data will help gauge the potential redistribution of commercial vehicle travel, behavior, speed impacts and crossing frequency.
When measuring toll impacts, in-depth commercial vehicle data offers deeper insights than public datasets, revealing the “why it matters” behind freight behavior. Whether you’re a planner modeling corridor performance, or a fleet manager benchmarking crossing strategy, these data details expand the scale of what questions you can explore.
Learn more about studying movements between standard zones, custom zones or road segments with Altitude’s Origin & Destination analytics.
Significantly. After the toll increase took effect on January 1, 2025, heavy-duty truck trips on the Ambassador Bridge dropped 32% — from roughly 22,500 trips per month in Q1 2024 to around 15,200 by Q1 2026. Both the number of unique vehicles and trips per vehicle declined, each by about 10%. The shift was visible almost immediately in the data, with BWB volumes surging sharply in the same month the Ambassador toll increase took effect.
Public traffic counts tell you how many trucks crossed. Commercial vehicle telematics data tells you why it matters operationally. Aggregate commercial vehicle data can distinguish between a routing-frequency shift and a full corridor realignment — two scenarios that look similar in raw volume numbers but have very different implications for planning. In this case, it revealed that BWB’s volume growth wasn’t driven by new fleets switching bridges, but by existing users crossing more often. It also surfaces approach speed trends at a granular level — by distance band and time of day — which public counts don’t capture at all.
Measurably. Morning approach speeds on roads leading to the Blue Water Bridge have fallen 10–14% as volumes have grown. Within one mile of the bridge, motorway speeds are down 10% during morning hours. The congestion effect is most pronounced close to the crossing and during peak approach windows — meaning the delay risk is real but concentrated, not distributed evenly across the day.
It depends on the load. For high-frequency, non-time-sensitive runs, the toll savings still stack up — BWB users are crossing more often precisely because the economics work. But for time-sensitive freight, the calculation is shifting. Morning approach speeds are down 10–14%, and congestion will likely increase further as volumes grow. Operators should model toll savings against realistic delay exposure during peak windows, rather than assuming BWB is a straightforward cost win across all load types.
See how freight route planning for weekday events can cut harsh braking risk. Real traffic data from Leo Messi and Cristiano Ronaldo’s June games reveals why.
Toll changes at the US-Canada border shifted truck traffic — and revealed the hidden freight congestion impact on delivery times, penalties and regional economic health.
Our Arizona case study illustrates how to capture true last-mile delivery behavior to inform infrastructure wear and tear, safety, curbside management, and more.