Key metrics reveal market share wins and losses
Benchmarking your operations against that of your competitors can be a time-consuming one-by-one project dependent on which competitors you can identify and collect information about.
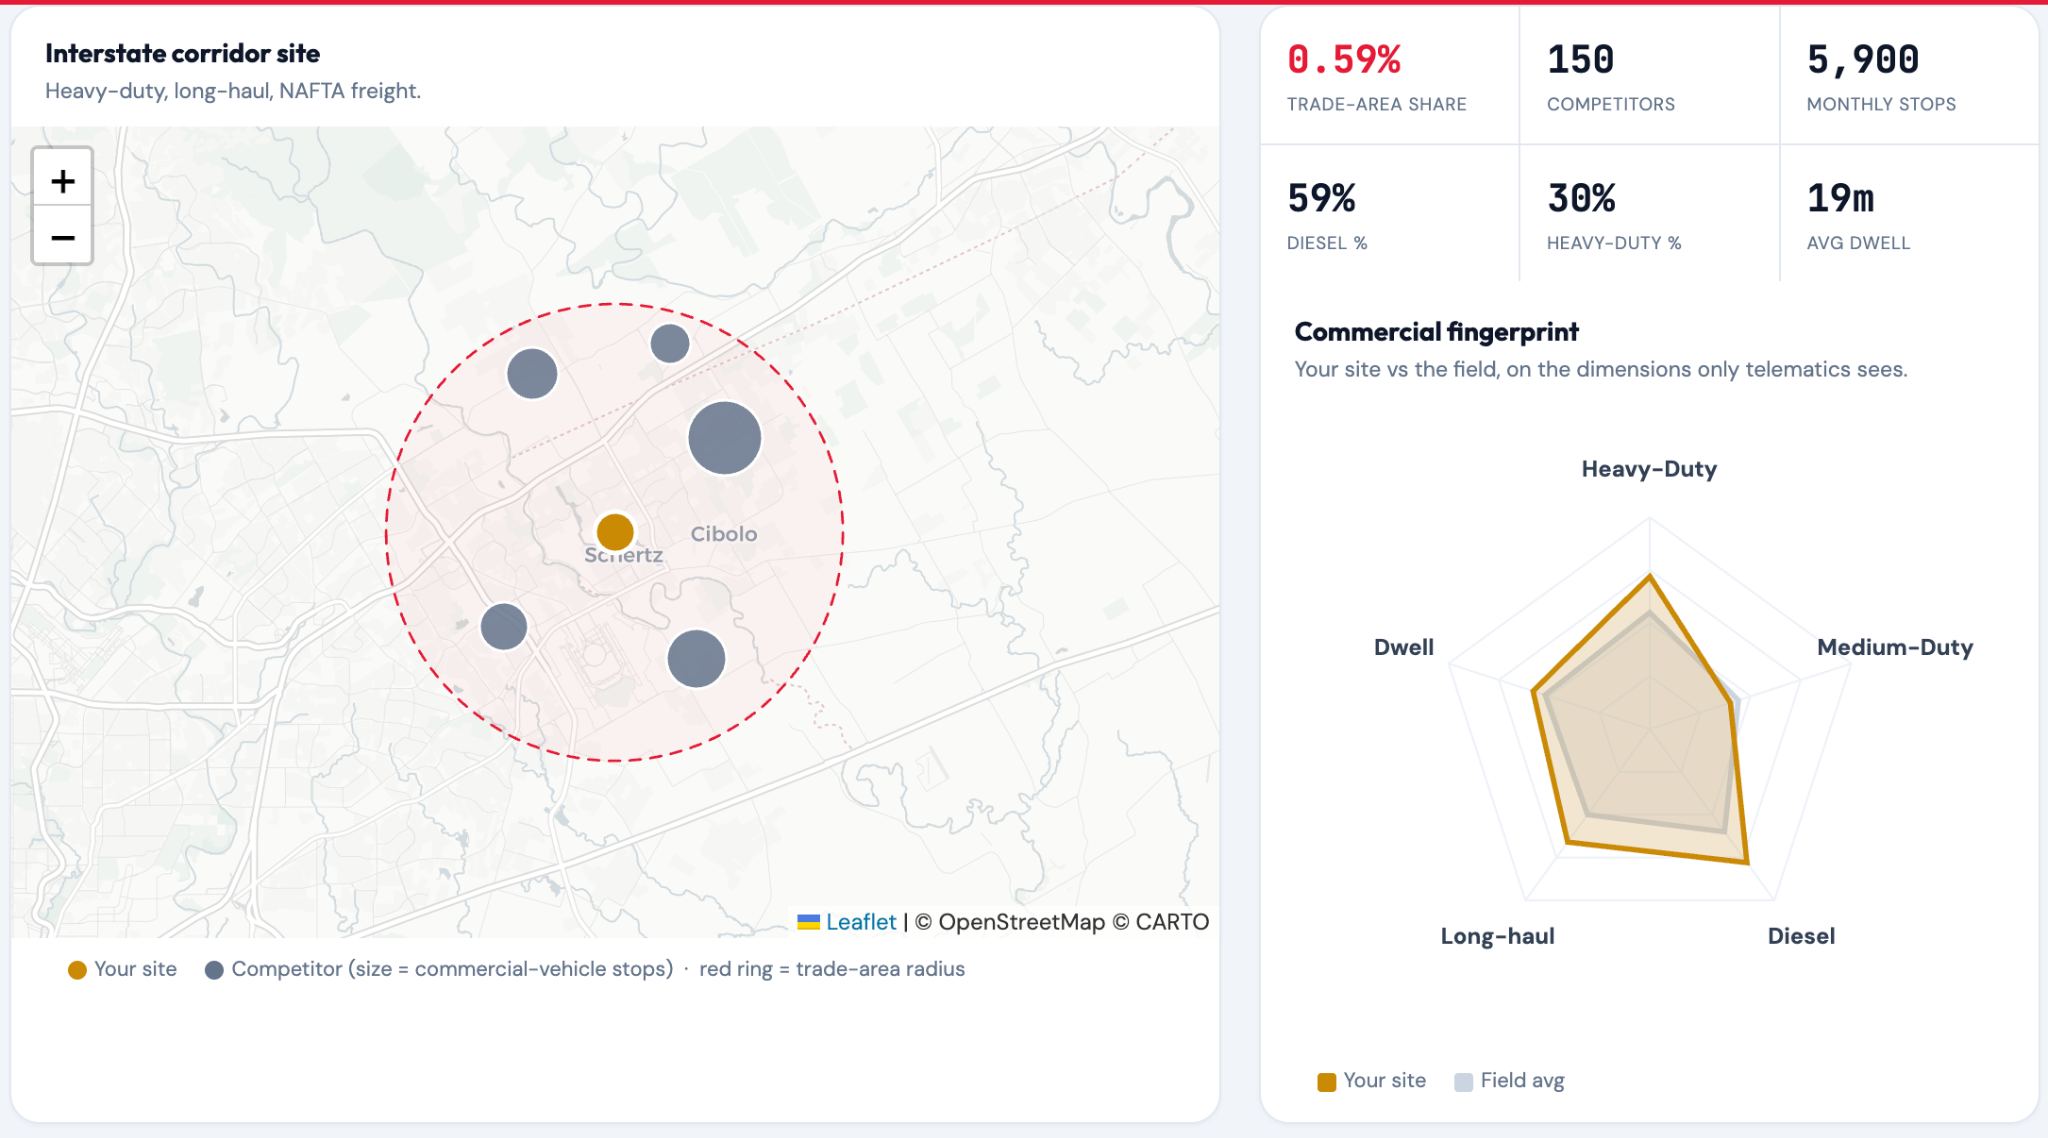
Instead, Altitude’s POI identifies all competitors within a defined radius, and captures stop data for every one over time. It measures your trade-area stop share by dividing the number of stops your location sees by all commercial-vehicle stops within the radius. That metric is a clear indication of location performance and trends compared to all others in the trade area.
This detailed data answers other critical business questions, including:
- What types of trucks stop, and for how long, at my competitor sites?
- Is my competitor capturing higher-value heavy vehicle classes, or specific vocations like tankers or long-haul fleets?
- Is a site performance dip shared by other nearby businesses? Is it market-wide?
- Which brands pull in the heaviest, longest-dwelling trucks?
- Which types of trucks choose to stop at which brands?
- How much of each type of fuel is being purchased?
- What is the competitive stop landscape around the site I’m evaluating for acquisition?
Select any location, set your trade area radius, and Altitude’s POI surfaces every competing brand within that area — alongside your own performance metrics, side by side. Analyst-ready tables can be shared for investment decisions and stakeholder presentations.
Deeper insights power smarter investments
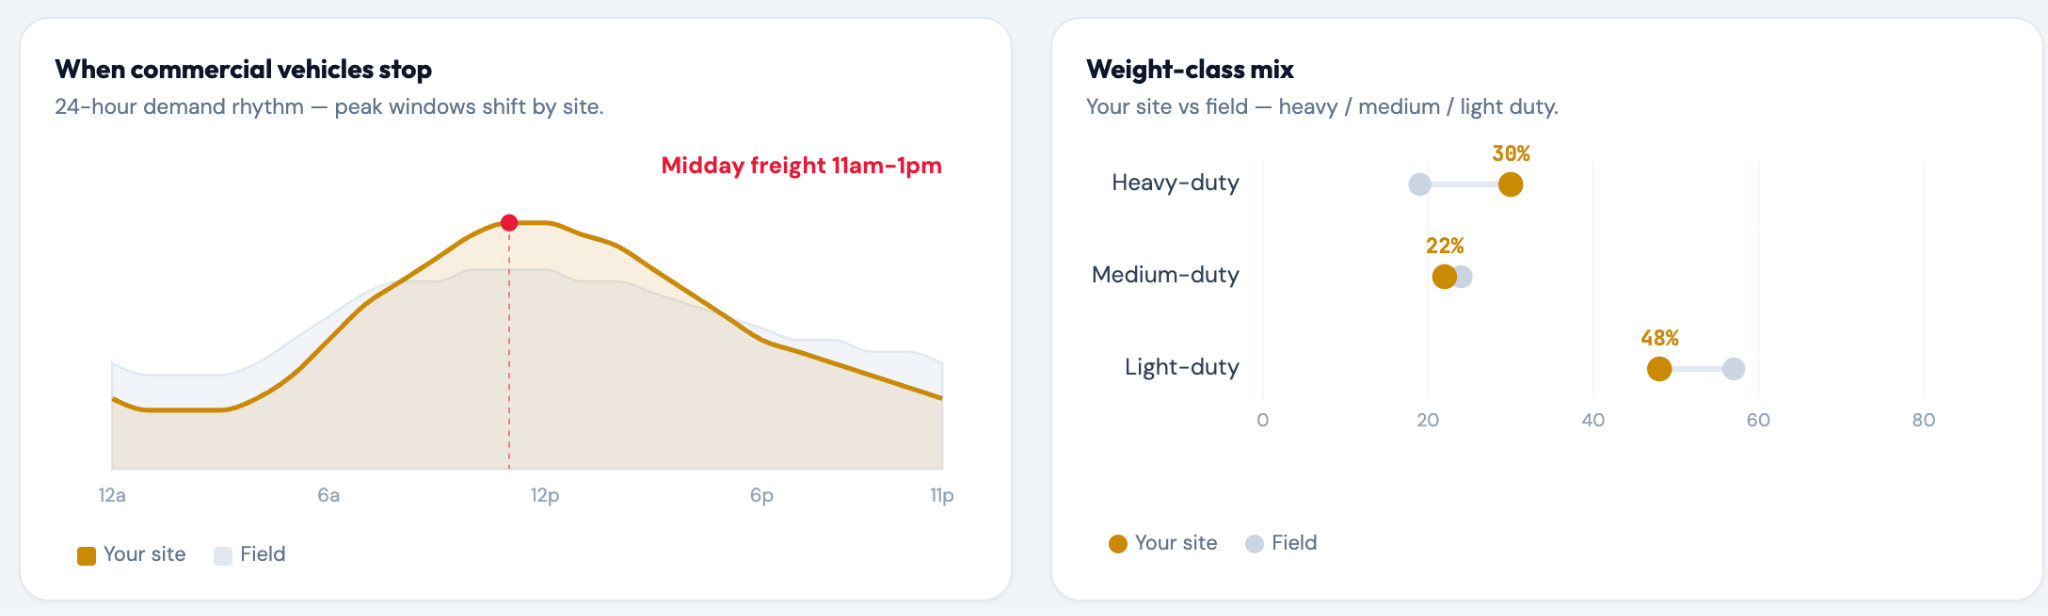
Users can simply select a site, set a study radius, and get monthly commercial vehicle stop counts at that location and every competitor in the area. Metrics include stop counts, dwell-time distribution, fuel type, vehicle class, vehicle vocation and fleet size.
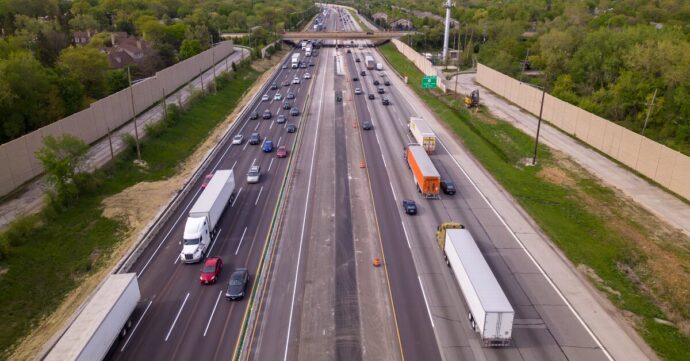
For example, consider a site acquisition analysis that compares two potential locations. Traditional roadway counts show that Site A receives 3x the pass-by heavy-duty truck traffic that Site B does. Site A looks like the winner.
But what those metrics don’t reveal is that Site A has 20% fewer actual stops than Site B, and that number has been shrinking. Not only that, but Site A has a competitor down the road that pulls 5x more heavy-duty stops, and their percentage share is growing.
Site B’s pass-by traffic is lower, but the total heavy-duty stop number is on par with Site A and has been growing quarter over quarter. And its closest competitor only sees half the stops of Site B.
Knowing that, which site would you invest in now?
Fuel retailers and travel center operators have always had a view of their own performance. But now, they can evaluate potential sites or even benchmark against competitors. Altitude’s POI metrics fill in business-critical gaps that vehicle counts can’t. The details of what type of truck stops where and what fuel it purchases are a serious competitive differentiator.