
Precision Site Selection
Assess commercial vehicle stop behavior across regions and corridors before you break ground. Understand your competitive position in any trade area — and identify where gaps exist for new development.

Benchmark commercial vehicle stop behavior at any site against every competitor in a defined trade area — providing the market context that internal performance data alone can’t offer.
By combining Altitude’s commercial vehicle stop data with business location context, you can benchmark any site against competitors within a defined trade area — and see the metrics that matter: stop counts, dwell times, vehicle class, vocation breakdown, and more. For P&G operators making site investments in the $10–15M range, this is the layer of intelligence that’s been missing.
From trade area querying to vocation-level breakdowns, POI Location Specific Insights surfaces competitive stop intelligence at any site — in analyst-ready output grounded in a transparent, consistent attribution methodology.
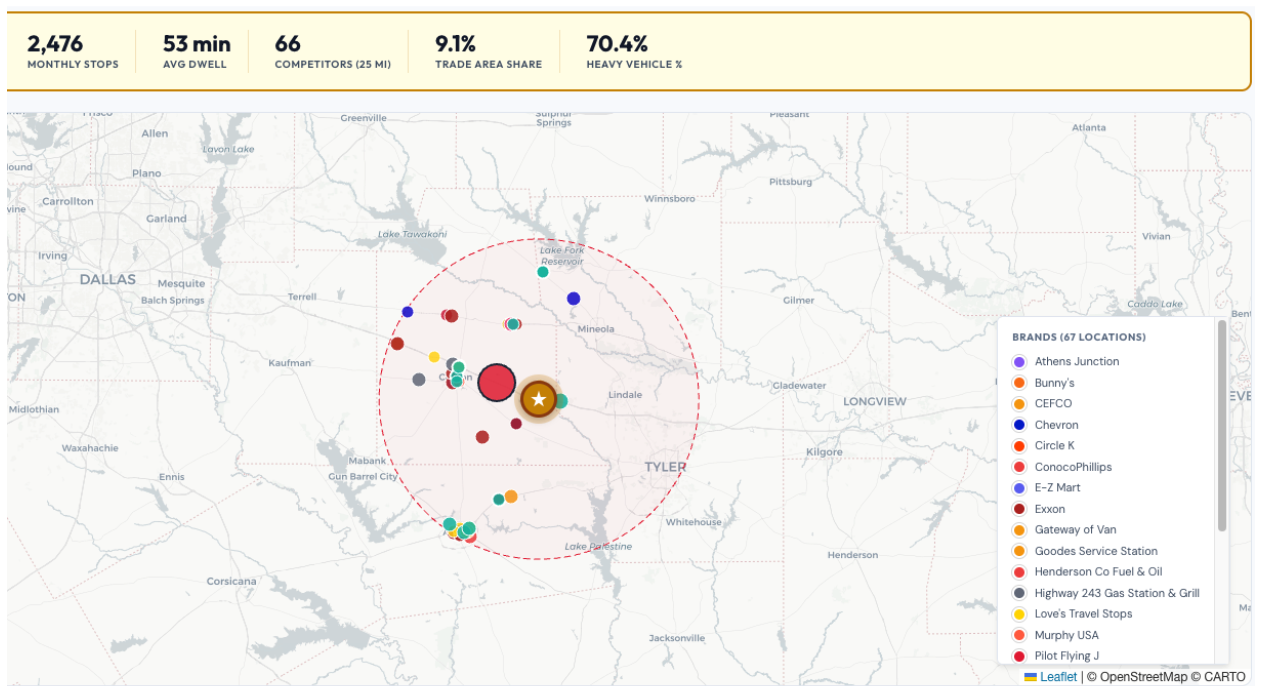
Select any location, set your trade area radius, and POI LSI surfaces every competing brand within that area — alongside your own performance metrics, side by side.
See monthly stop counts, average dwell time, heavy vehicle percentage, and top vocations for every competing location in your trade area. Know not just how many trucks are visiting — but what kind, and how long they’re staying.
Data is segmented by vehicle class (Class 8, medium, light), fuel type, vocation (long haul, for-hire, private fleet, tanker), and fleet size. Consumer location data and traffic counts can’t give you this. Altitude can.
Export structured tables for use in site selection reports, investment memos, or board presentations. The methodology is consistent across all locations — making relative comparisons defensible at every level of your organization.
40–50% of commercial vehicle stops are attributed to named POI locations — a reflection of how commercial vehicles actually operate, not a limitation of the data. Altitude only attributes a stop when GPS trace, dwell time, and proximity all align: confidence over coverage.
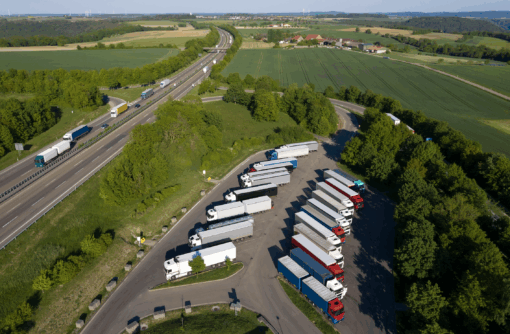
POI LSI is built on actual commercial vehicle stop data from more than 6 million vehicles generating 50 billion daily records every day. No consumer proxy data. No extrapolated assumptions. No 5% samples.
Consumer location providers can’t distinguish truck types or commercial intent. Consultant studies are expensive, slow, and point-in-time. Traffic count providers give you road volumes without stop attribution.
Altitude gives you the observed commercial reality — at POI level, at scale, available when you need it.
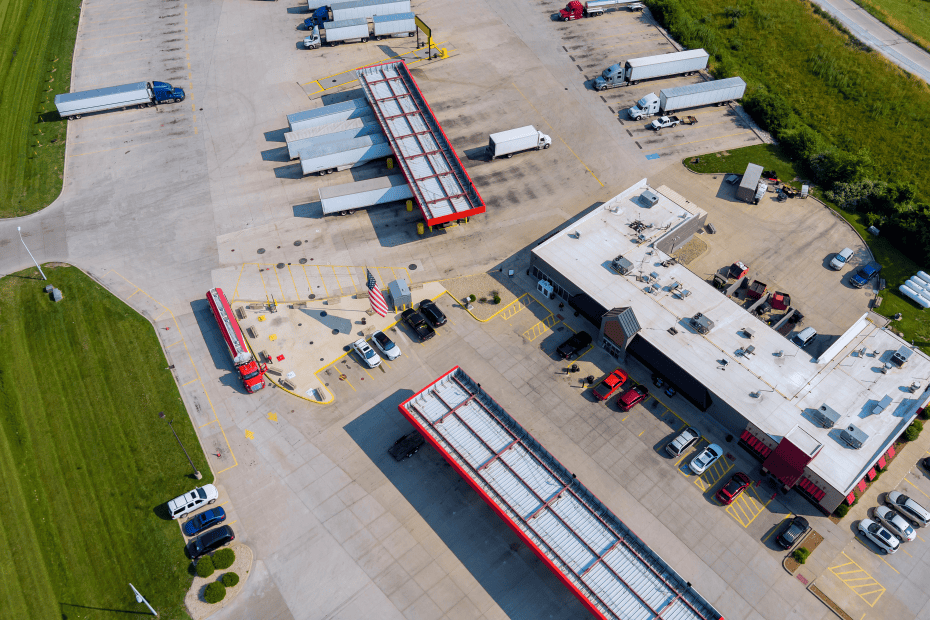

Surface stop counts, dwell times, and vocation breakdowns across any trade area in a single view. Discover how observed commercial vehicle intelligence informs defensible site strategy and sharper capital decisions.