How planners can forecast freight bottlenecks
Proactive state freight planning starts with early bottleneck detection. Learn how Altitude’s data helps planners identify emerging issues, rank corridors and build smarter solutions.

Fuel retail isn’t won with national averages. It’s won corner by corner, daypart by daypart. It’s won by understanding how commercial vehicles actually move and why they choose one location over another. It’s won by knowing what turns a visit into a fueling stop and how to turn that fueling stop into margin.
In our recent webinar hosted by NACS, the Altitude by Geotab team shared a practical way for diesel-lane and truck-stop operators to compete with evidence. It showcased how to work the entire funnel from regional demand to canopy throughput and benchmark the competitors who matter in your corridor. The webinar also covered how to use insights such as route directionality or daypart behavior to guide remodels and new-to-industry (NTI) decisions.
Watch the recap here and expand that content into a playbook you can put to work now, or keep reading for an overview of some of the topics that were covered.
A major theme from the webinar was the importance of viewing site performance as a connected funnel rather than a collection of isolated metrics. Many retailers rely on dashboards that blend traffic, visits and fueling, which makes it difficult to see where performance is breaking down. The discussion introduced a clearer way to organize those indicators into five linked stages that move from market activity to profitability.
Separating property visits from fueling activity, both conceptually and in measurement, helps operators pinpoint where performance issues originate. By viewing each stage of the funnel in relation to the others, patterns become clearer.
Rising demand paired with flat captures can point to visibility or ingress challenges that limit conversion. Growth in captures without improvement in fueling rate may signal inefficiencies in lane balance or payment flow. Declining time on premises might reflect reduced engagement or missed opportunities in the store.
Understanding how these metrics interact shows where performance breaks down and where operational changes will drive the most gain.
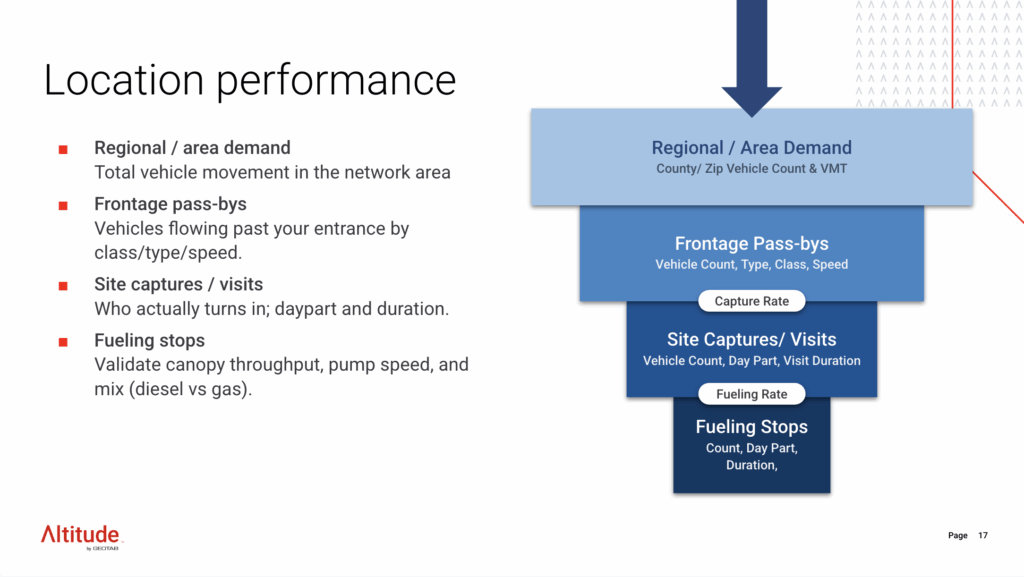
Evaluating the performance of a location requires looking at the entire operational funnel.
Another focus of the webinar was how understanding site activity by time of day and approach direction can reveal overlooked opportunities. After all, time and direction will each influence how drivers approach a site or if they are going to stop.
Each daypart represents a separate market with its own rhythm and requirements. Whether it’s early morning weekday traffic or midday weekend peaks, the individual time period will have its own distinct patterns. By measuring pass-by, visits and fueling within these periods, operators can optimize their operations. They can tailor staffing, inventory and promotions to match real demand rather than broad averages.
Studying approach direction adds more insight into how drivers reach the site. Route analysis shows which paths bring vehicles to the frontage and where visibility or access may be limiting performance. With that understanding, operators can make more deliberate decisions about signage, wayfinding, or layout. Often, a single approach direction accounts for most missed turn-ins and resolving it can quickly improve overall capture.
Together, these two lenses show when drivers engage and how they arrive, giving operators a more straightforward path to translate traffic into results.
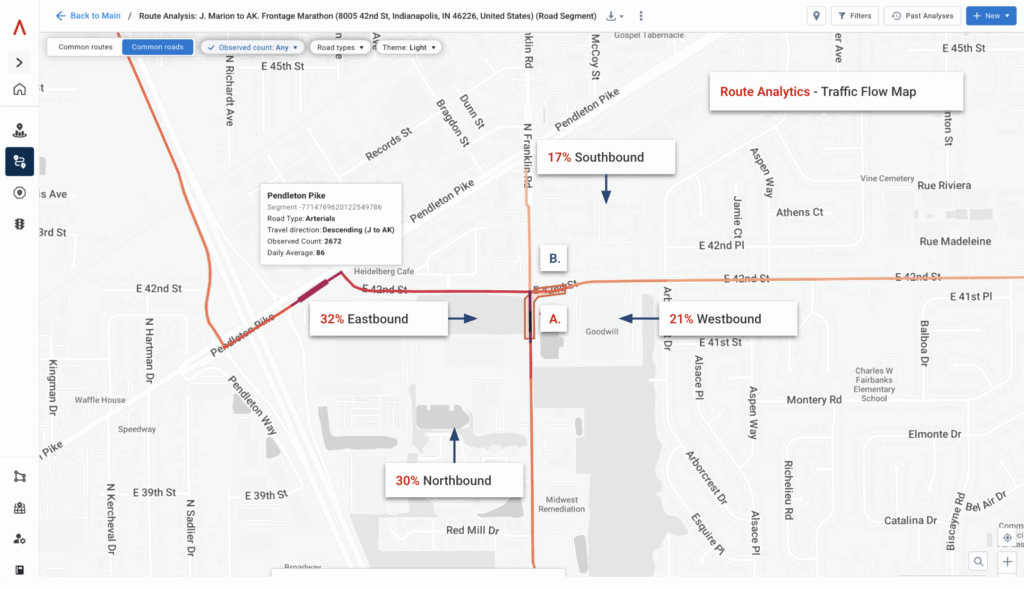
Route Analytics within the Altitude Platform shows how you can review approach direction.
The webinar highlighted the importance of measuring performance against the competitors that truly share your traffic. Anecdotes about the site across the street don’t reveal much.
Real competitive insight comes from comparing how nearby sites perform with the same passing vehicles, using observed movement. Regular benchmarking creates a clear, repeatable process for understanding where volume is gained or lost along a corridor.
Start by asking focused questions such as:
When comparing sites that share the same passing traffic, real patterns begin to stand out. Some locations capture more of that flow, while others lose it before a turn-in ever happens. Looking at fueling rate, canopy dwell and time on premises explains why. These measures show whether performance comes from speed, access or a better experience once drivers stop.
Benchmarking in this way builds understanding that grows with each review. Early findings might expose simple fixes like lane balance or signage.
Later, the same process can point to deeper issues, such as brand perception or loyalty gaps.
Over time, operators will develop a clearer picture of how competition along the corridor shifts and how small, deliberate changes can tilt more volume their way.
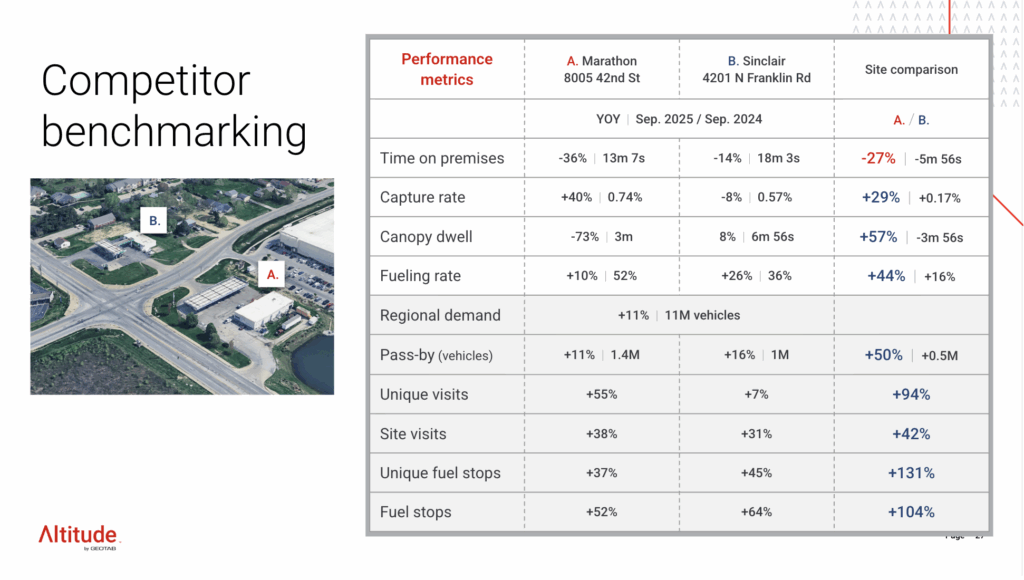
Above is an example of competitor benchmarking that compares the performance of two nearby locations.
The section on new-to-industry (NTI) development focused on grounding investment decisions in evidence. For major projects like diesel lanes, parking, showers, or foodservice, the starting point should be unmet demand, not available land. Operators need to locate where diesel fueling and overnight parking are lacking. Then they can focus on the vehicle types and routes that match their objectives.
After defining that demand, the next step is to study corridor movement. Ranking routes by traffic patterns and direction of travel helps reveal frontages with real exposure. Only then should parcels be compared on measurable factors such as pass-by, captures, fueling rate, dwell time and overall trends.
This approach replaces intuition with proof. It ensures that each potential site serves a clear purpose and meets a verified need before any capital is committed.
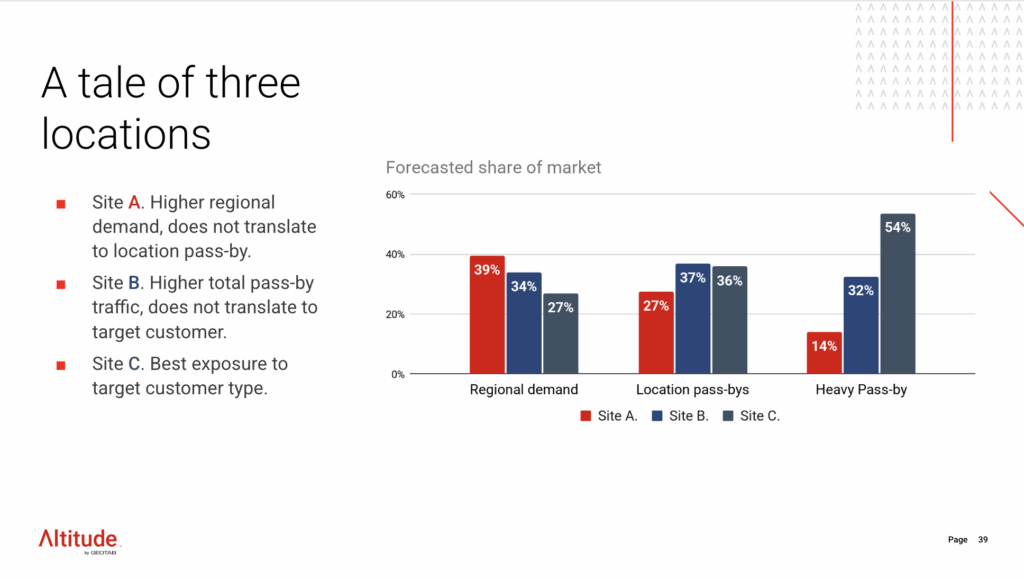
A slide from the webinar that explores site performance. Site A sits in a hot region, but doesn’t translate to frontage exposure. Site B has high pass-by, but the wrong vehicle mix for your diesel goals. Site C aligns frontage and target composition—and wins.
Finally, the webinar connected these insights to everyday operational decisions, showing how data can guide improvements across the entire site experience.
At the canopy, fueling rate and dwell time reveal how efficiently drivers move through each lane. When backups occur at predictable times, the problem usually stems from circulation or transaction flow. Adjustments to layout, queue management, or payment process can increase throughput without relying on price changes.
Inside the store, the same data helps connect fueling activity to backcourt performance. When dwell coincides with peak fueling periods, retailers can use those windows to strengthen in-store sales. Coordinating staffing and product availability with those peaks keeps service consistent and encourages additional spend.
Loyalty brings these insights together. Identifying which routes and times draw returning drivers makes it possible to tailor programs that reflect actual habits. Aligning offers with how and when customers visit strengthens retention and links canopy performance with overall site profitability.
When operators apply these insights consistently, the result is a site that runs with greater precision. Each decision is based on evidence, improving efficiency, customer experience, and long-term performance.
Altitude by Geotab gives operators a clearer view of how commercial movement drives performance. It goes beyond raw dots on a map to show where demand builds, how sites capture it, and what limits throughput.
Corridor, frontage, site, and canopy insights work together in one platform so teams can see the full picture, allowing them to act quickly. The same intelligence can also connect through API for system-wide integration, keeping data current, aggregated and anonymized.
We invite you to experience the difference between national averages and precise, observed commercial movement.
Start with evidence of unmet demand, not available land. Use commercial movement data to locate where diesel fueling and overnight parking needs aren’t being met. Then rank corridors by vehicle type, route patterns, and direction of travel to find frontages with real exposure before comparing individual parcels.
Corridor benchmarking compares your site’s performance against nearby competitors that share the same passing traffic. It shows who earns more turn-ins, who fuels more vehicles, and who holds customers longer on site, helping operators focus improvements where they can gain the most volume.
Studying site activity by time of day and approach direction shows when and how drivers choose to stop. Daypart trends reveal peak fueling windows, while directional patterns highlight which routes deliver vehicles to your frontage. Together, they help operators adjust staffing, signage, and access to capture more of the traffic already passing by.
Proactive state freight planning starts with early bottleneck detection. Learn how Altitude’s data helps planners identify emerging issues, rank corridors and build smarter solutions.
See how we helped planners improve safety, efficiency, and data-driven decision-making in 2025 — and where we’re heading in 2026.
Understand where around the country holiday shopping is a big deal and where it’s just business as usual according to commercial vehicle data.