Freight route planning for events: Soccer cities with the best traffic stats
See how freight route planning for weekday events can cut harsh braking risk. Real traffic data from Leo Messi and Cristiano Ronaldo’s June games reveals why.

On January 24-26, 2026, a massive winter storm, unofficially referred to as Winter Storm Fern by The Weather Channel and various news outlets, swept across the eastern United States and Canada, bringing record-breaking snowfall and arctic temperatures to regions where southern freight planning doesn’t prepare for such severe weather. The storm dumped higher volume on northern regions, with a record-breaking single snowfall amount of 24 inches (61 centimeters) on Toronto. But our analysis reveals that while the southern U.S. received much less precipitation, it bore the brunt of the economic impact.
Here, we reveal where commercial vehicle activity plummeted unexpectedly by more than half, and why previously insulated regions must protect against future economic damage from increasingly severe winter storms.
Winter Storm Fern was a massive, slow-moving system that brought severe conditions across an unusually large geographic area. Northern cities received anywhere from 7-24 inches (17 – 61cm), with Philadelphia, Columbus and Toronto breaking snowfall records.
In the southern U.S., precipitation totals were lower than in the north, typically two to six inches (5 – 15cm), but many areas plunged into record-breaking low temperatures.The unusual cold would prove to be the south’s undoing.
Altitude by Geotab analyzed commercial vehicle telematics data from 15 major cities and discovered dramatic disruptions to freight and business operations during the five-day period from January 23-27, 2026. Comparing vehicle volumes to a normal baseline period (December 5-18, 2025), the impact ranged from minimal in some northern cities to catastrophic in the South:
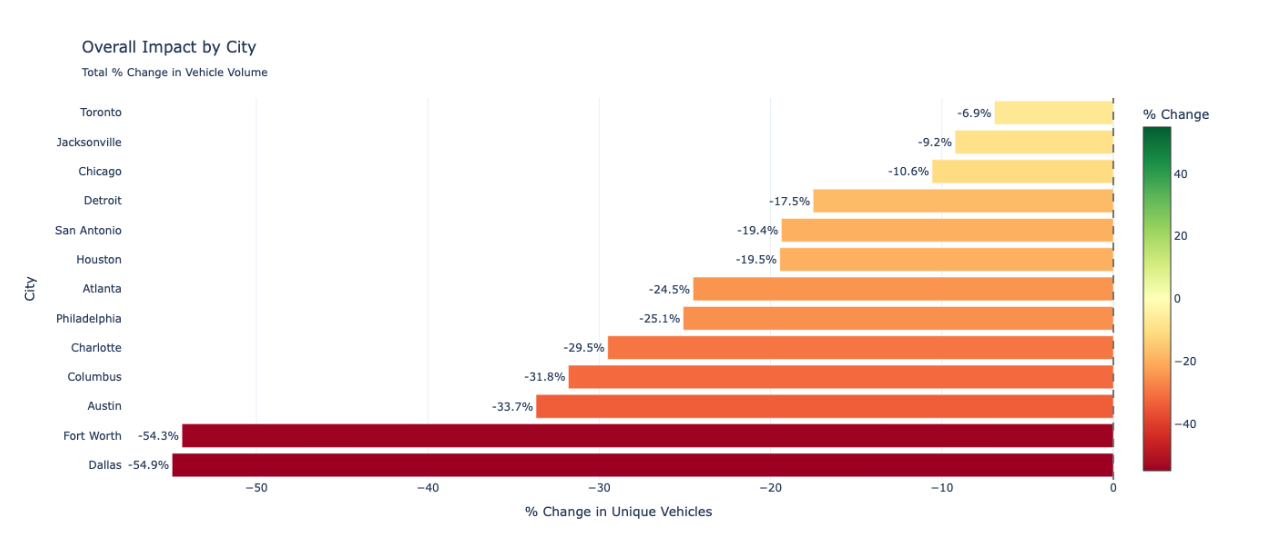
Figure 1: Altitude’s analysis shows that southern cities felt the most impact on freight travel.
Austin’s 33.7% overall economic decline during and after the storm reveals a dramatic story when examining hour-by-hour data. The heatmap of commercial vehicle activity reveals a city that progressively shut down as conditions deteriorated.
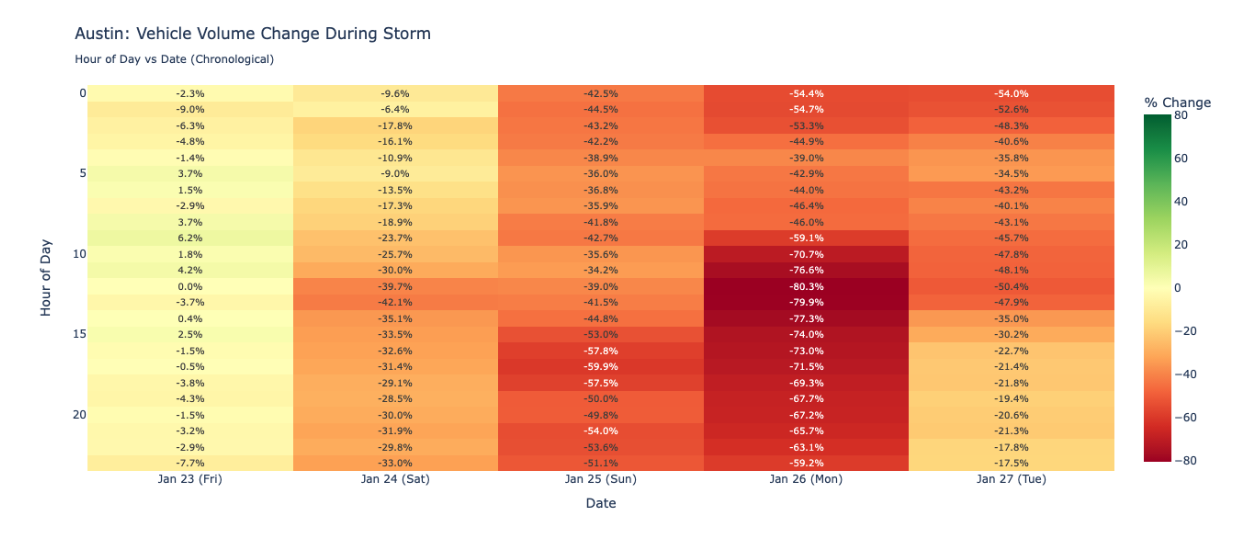
Figure 2: Austin’s commercial vehicle movements halted, illustrating a growing need for southern states to plan for winter storms like Fern.
On Friday, January 23, commercial activity remained largely normal, with only minor deviations from baseline (mostly single-digit percentage changes). This was Austin on a typical winter day, with delivery trucks making their rounds and service vehicles operating normally.
The situation began deteriorating on Saturday, January 24 as the storm arrived. By midday, commercial vehicle volumes had dropped 30-40% across most hours. Saturday evening and overnight saw particularly severe impacts, with some periods showing 40-42% reductions as conditions worsened and fleet managers began pulling vehicles off the roads.
Sunday, January 25 marked the storm’s peak. The data shows striking losses throughout the day:
The deepest red on the heatmap appears on Monday, January 26 — the day after the storm peaked. This was when Austin’s commercial activity reached its lowest point:
Why did Monday show the worst disruption, after the storm had already peaked? The answer: Ice.
As precipitation ended Sunday night, temperatures remained below freezing, transforming wet roads into skating rinks. Without adequate de-icing resources and with ice accumulating overnight, Monday morning commuters and fleet managers faced the most dangerous conditions of the entire event.
By Tuesday, January 27, Austin’s recovery was beginning but remained incomplete:
This granular view reveals that Austin didn’t experience a simple “storm day” disruption. Instead, the city faced a progressive, multi-day shutdown that reached its worst point a full day after the precipitation ended — a pattern that reflects both inadequate road treatment infrastructure and the particularly hazardous nature of ice versus snow.
The paradox at the heart of this data is striking: Toronto received 10 times more snow than Dallas, yet Dallas experienced eight times greater commercial disruption. Several factors explain this counterintuitive finding.
While northern cities received more snow, southern cities faced a more dangerous hazard. Temperatures hovering around freezing meant precipitation fell as freezing rain or sleet before turning to snow, creating a layer of ice beneath the snow. This is significantly more hazardous and difficult to manage than pure snow, particularly with limited de-icing resources.
Northern municipalities typically pre-treat roads with brine solutions before storms, then maintain continuous plowing and salting operations. But southern cities tended to wait for the January storm to arrive before responding, and many lacked adequate stockpiles of road salt. Once ice formed, it remained for days.
Northern cities also maintain extensive fleets of snowplows, salt trucks and de-icing equipment. For example, Toronto deployed over 600 plows during the storm while Dallas had fewer than 100 pieces of snow-removal equipment for a similarly-populated metropolitan area.
Commercial vehicles in northern cities are routinely equipped with:
Southern fleets typically lack these features. When temperatures plunged and roads iced over, vehicles literally couldn’t operate safely even if drivers were willing to try.
Northern businesses and customers expect some level of service continuity during winter weather, so supply chains are more likely to have built-in alternate plans and financial projections. When severe winter weather hits the South, the entire commercial ecosystem typically shuts down without warning, leaving businesses scrambling to recover logistically and financially.
The stark differences in impact translate to three levels of real economic consequences:
Hardest-hit cities (over 50% decline): With more than half of commercial vehicles sidelined, Dallas and Fort Worth experienced severe delays in freight and package deliveries, disrupted supply chains affecting retail and manufacturing, lost productivity from service vehicles unable to reach job sites, and significant revenue losses for logistics and transportation companies.
Mid-tier impact cities (20-30% decline): Atlanta, Philadelphia and Charlotte saw substantial but not catastrophic disruption. Essential deliveries likely continued, but non-urgent commercial activity ceased.
Resilient cities (under 15% decline): Chicago, Detroit and Toronto maintained majority commercial operations, limiting economic damage and supply chain disruptions.
This data offers several insights for southern city planners, fleet managers and businesses:
The January 2026 storm provided a natural experiment in urban resilience and infrastructure preparedness. While the same weather system affected all 15 cities analyzed, the outcomes varied dramatically based on temperatures, preparation and equipment. Dallas and Fort Worth, with half their commercial vehicles unable to operate, illustrate what can happen to cities and businesses unprepared for extreme weather events.
As climate patterns continue to shift, bringing more extreme and unusual weather to regions unaccustomed to such events, the economic case for improved winter freight planning in the south grows stronger. The cost of occasional snowplows and salt stockpiles pales in comparison to the economic losses from a completely paralyzed commercial transportation network.
Analysis based on Geotab telematics data from commercial fleet vehicles across 15 North American cities. Baseline period: December 5-18, 2025. Storm period: January 23-27, 2026. Methodology tracks unique vehicles operating in each metropolitan area, comparing storm period activity to baseline averages.
How strong is your city’s freight economy? Get the Altitude Freight Efficiency Report to see which U.S. cities are leading the way in urban freight efficiency and which ones are falling behind.
See how freight route planning for weekday events can cut harsh braking risk. Real traffic data from Leo Messi and Cristiano Ronaldo’s June games reveals why.
Toll changes at the US-Canada border shifted truck traffic — and revealed the hidden freight congestion impact on delivery times, penalties and regional economic health.
Our Arizona case study illustrates how to capture true last-mile delivery behavior to inform infrastructure wear and tear, safety, curbside management, and more.