
Key Insights
- Using DOT and MPO metrics, city planners can get early insight into emerging trends that could impact curbside and other commercial vehicle activity.
- Studying freight movements outside the city sphere can reveal upstream details about how vehicles are using city infrastructure, and how that may be about to change.
- While DOTs may rely on data like rising truck utilization rates to anticipate more highway corridor travel, city planners can use the same data to infer developing urban trends like tighter curbside competition.
A series exploring the Health of the U.S. Supply Chain report and how truck movements connect across DOTs, MPOs and city planners. Here we identify a handful of "edge" metrics that can help each group see past their usual dashboard.
Freight metrics for city planners can help reveal what’s happening beyond the curb, and what’s coming next. City planners usually see freight only where it meets the street: delivery vehicles at the curb, trucks on local roads and congestion around commercial districts. But some of the strongest signals of changing commercial vehicle activity happen well beyond the curb – in regional freight nodes, long-haul corridors and local distribution networks. This article looks at three metrics typically associated with DOTs or MPOs that can give city planners an earlier view of delivery demand, network pressure and the freight activity that will eventually reach their streets.
1. Corridor penetration (vehicle share vs. mileage share on a specific route)
Corridor penetration compares two different ways of measuring highway corridor travel volume. We compare what share of a fleet's total mileage happens on that corridor versus what share of the fleet's vehicles touch the corridor. That's a classic interstate-network statistic — the kind of thing a DOT tracks to understand how much of its truck traffic depends on a given route.
Why a city planner should care: Truck mileage and number of trucks don't always move together. When those numbers diverge, it reveals something about how trucks are using that corridor. If the share of vehicles touching a corridor rises faster than the share of miles being driven on it, that means more individual trucks are dipping onto that route for short stretches rather than a smaller number of trucks running longer distances. Near a metro's edge, that pattern usually means those trucks are headed somewhere local. They tend to merge onto the highway just long enough to reach a city warehouse, distribution center or delivery route before exiting again.
That's last-mile traffic hiding inside what looks like a pure interstate statistic. It’s exactly the kind of volume a city planner needs to anticipate for streets feeding into downtown or industrial districts.
Real-world example: Our Health of the U.S. Supply Chain report found that the number of trips rose while mileage dropped for Door-to-Door delivery vehicles during the three quarters studied. This trend shows a higher volume of stops for each vehicle, suggesting increased curb competition and more delivery-area congestion.
2. Upstream mode-shift signals at a regional freight node
When freight volume shifts from one mode to another — say, from truck to rail at a port or rail yard, that's typically treated as a port authority's or DOT's metric. It looks like an infrastructure and logistics issue, often happening well outside a city's jurisdiction at a facility a city planner has no direct stake in.
Why a city planner should care: Freight arriving upstream doesn't stay upstream — it eventually reaches the city. If more containers are moving by rail instead of trucks at the port, that can shift the volume, timing and routing of the trucks picking up those deliveries. It can also change which city-level warehouses and distribution centers are being used.
That timing and volume data is a curb-planning input — it affects when and how many delivery vehicles show up at which distribution centers — even though it originates at a facility the city doesn't operate and may not even be located within its borders.
Real-world example: Our analysis found that at the San Pedro Bay ports, truck drayage volume fell roughly 1% while official port container volumes rose about 2%, suggesting rail absorbed the difference. That shift happened entirely outside any city's boundaries, at the port itself — but it can change the volume and timing of trucks arriving at the distribution centers those containers are headed to.
3. Regional distribution-network utilization
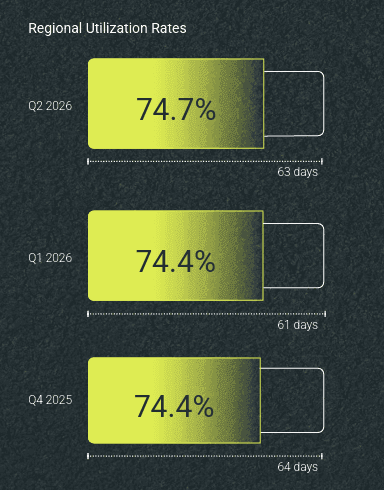
Utilization rate — how much of a fleet's available working capacity is actually being used — is usually read as a regional logistics or DOT-facing statistic, tracking how hard hub-and-feeder distribution networks are working across a whole metro or region, not any single city's streets.
Why a city planner should care: A distribution network running close to its capacity limit is an early-warning signal that eventually reaches the curb — but it reaches the curb last, after the pressure has already been building upstream for a while. As feeder and hub facilities across a region get squeezed, delivery windows compress and routes get packed tighter. That pressure eventually shows up in cities as more frequent double-parking, shorter curb dwell times and tighter delivery windows. A city planner who's only watching local indicators — 311 complaints, permit requests, curb-usage counts — will see that pressure only after it's already arrived. Watching the regional utilization number can reveal the trend while it's still building, with more lead time to plan for it.
Real-world example: In our report, Hub-and-Spoke utilization climbed to 84.3% over three quarters. To a DOT that’s a signal for future highway trip generation. But for a city planner that same climbing number means that the network feeding local deliveries is running close to full capacity, and that pressure is likely to show up soon as tighter delivery windows and more curb conflicts in city centers.
For city planners, the value of freight data isn’t limited to what’s happening on local streets. Metrics such as corridor penetration, upstream mode shifts and regional distribution-network utilization can provide an earlier view of the forces shaping truck movements, delivery demand and curb pressure. Looking beyond the curb gives planners more context, and more time, to anticipate how regional freight trends may translate into local transportation and infrastructure needs.
To see which freight signals can inform your city planning, and how to interpret them, get the full Health of the U.S. Supply Chain report.