No pit stop required: Special event traffic management planning
When auto racing shut down the Las Vegas Strip, freight kept moving. See how data-backed special event traffic management planning kept the city’s supply chain intact.


On January 5, 2025, New York City implemented congestion pricing in Lower Manhattan, charging most commercial trucks $14-$22 to enter the zone below 60th Street during peak hours. One year later, we had questions. Has the new toll reduced emissions in the city? Created smoother traffic flow? Hampered commercial traffic and the local supply chain?
To get answers, we analyzed aggregate telematics data from commercial vehicles to understand how traffic patterns have evolved under the new system. We found key insights about how travel in Manhattan has changed and how commercial vehicles are adapting.
Our analysis of average moving speeds between 8am and 6pm reveals a somewhat positive, but largely neutral picture. While 37% of roadways (by length) within the congestion zone are experiencing faster average speeds compared to 2024, 46% show no significant change and 16% have become slower.
This suggests that congestion pricing has had a measurable but uneven impact on traffic flow. The improvements are concentrated on certain corridors, while other roads continue to experience similar or worsened conditions. Little Italy, Chinatown and the Lower East Side show significant increased speeds.
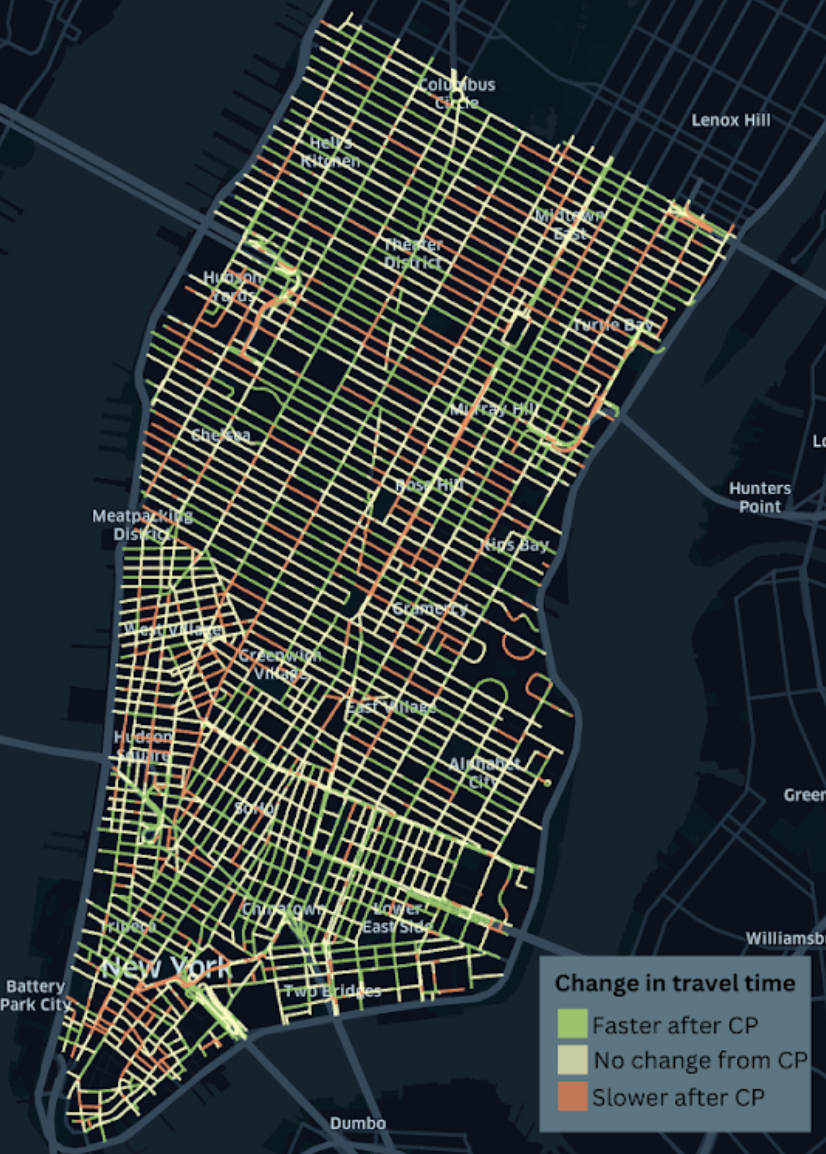
Figure 1: Roads highlighted in green, particularly in Little Italy, Chinatown and the Lower East Side saw faster traffic times after congestion pricing.
Perhaps the most surprising finding is how commercial vehicle usage patterns have shifted. On an average day in 2025, we observed 908 unique commercial vehicles entering the zone compared to 891 in 2024 — a modest <2% increase. However, each vehicle is making more trips: 4.6 trips per vehicle per day in 2025 versus 4.0 in 2024, a 15% jump.
For the purposes of our analysis, we define a “trip” as ending by a vehicle engine turning off or idling in one place for more than 3.3 minutes.
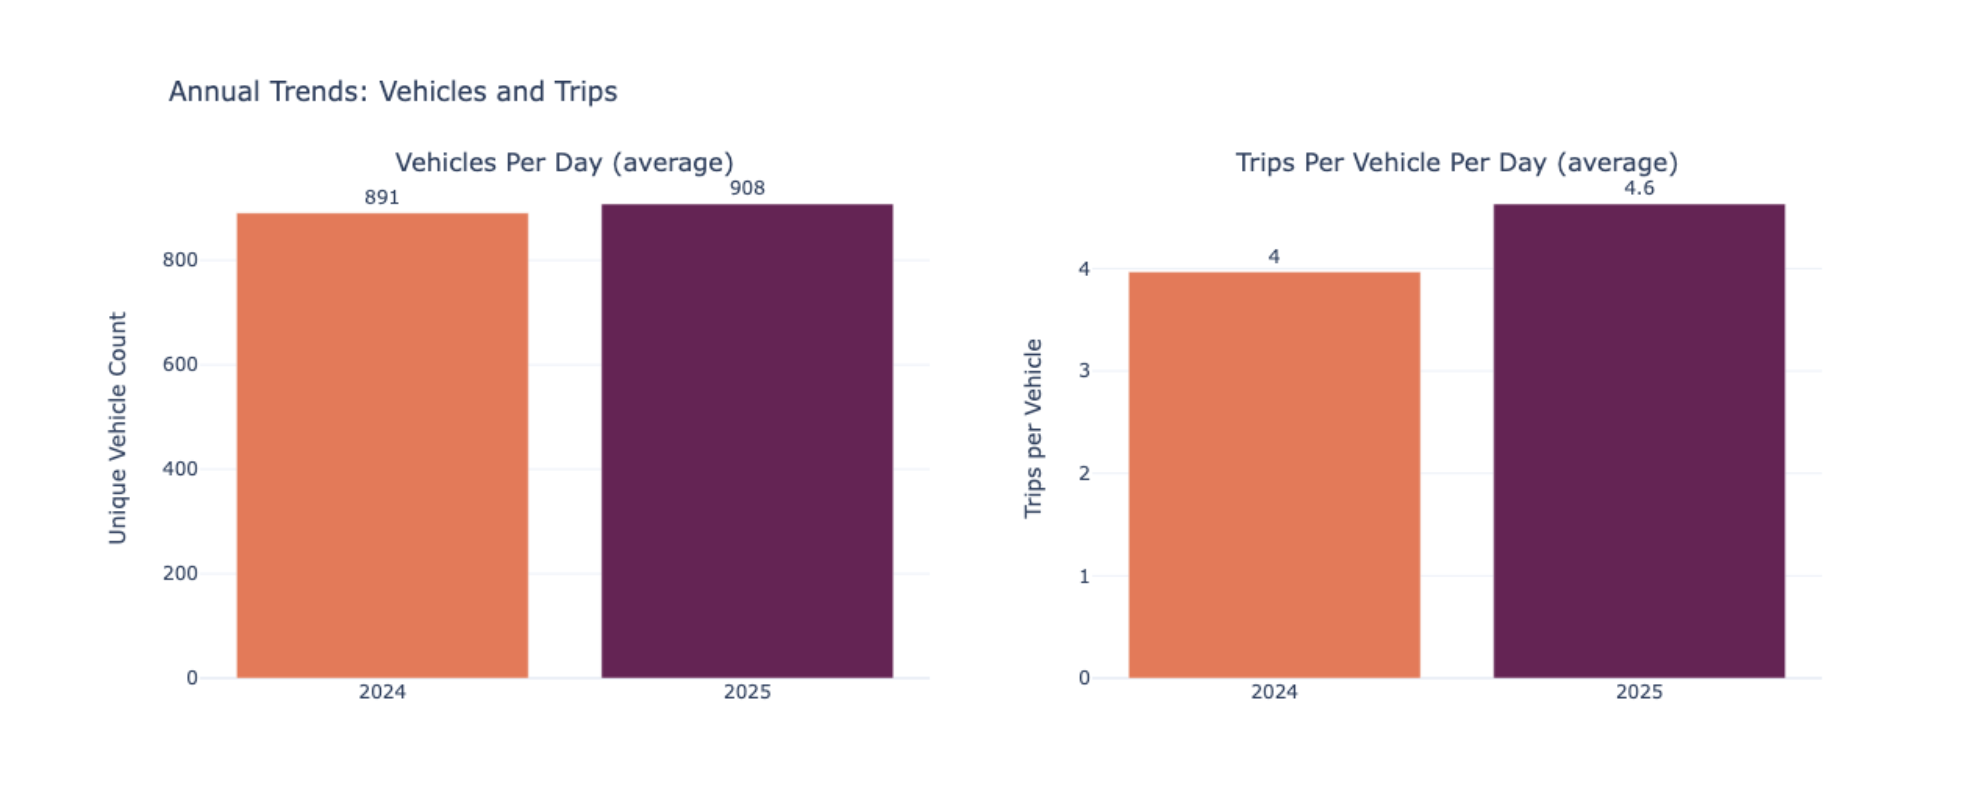
Figure 2: Congestion pricing raised the number of commercial vehicles entering Manhattan by about 2% per day.
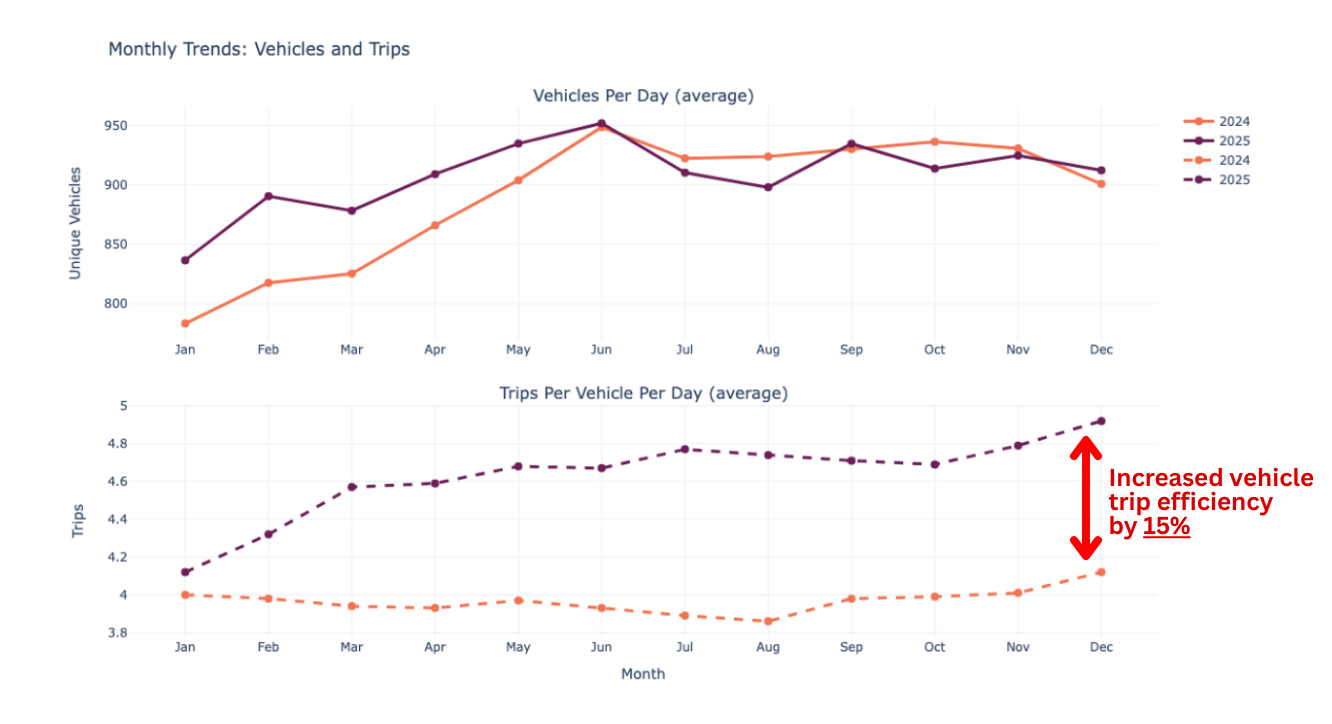
Figure 3: While only slightly more commercial vehicles are entering Manhattan after congestion pricing, each vehicle is making many more trips than in 2024.
Monthly data reveals an interesting seasonal pattern. The first half of 2025 saw notably more vehicles entering the zone compared to early 2024, but this gap closed in the second half of the year. By contrast, the number of trips per vehicle occurring at least partially in the zone remained consistently higher in every single month of 2025 compared to the corresponding month in 2024.
This suggests that the commercial vehicles entering the zone are being used more intensively, making more frequent deliveries or service calls per day to maximize efficiency and offset toll costs.
The breakdowns of commercial vehicle types operating in the congestion zone in 2024 and 2025 are similar, suggesting that the multi-purpose vehicle trend we noticed in the first six months of 2025 did not hold throughout the year. This is further supported by the vehicle-per-day plot in Figure 3 which indicates that January – June of 2025 showed markedly different behavior than the same period the previous year, however July – December were similar in both years.
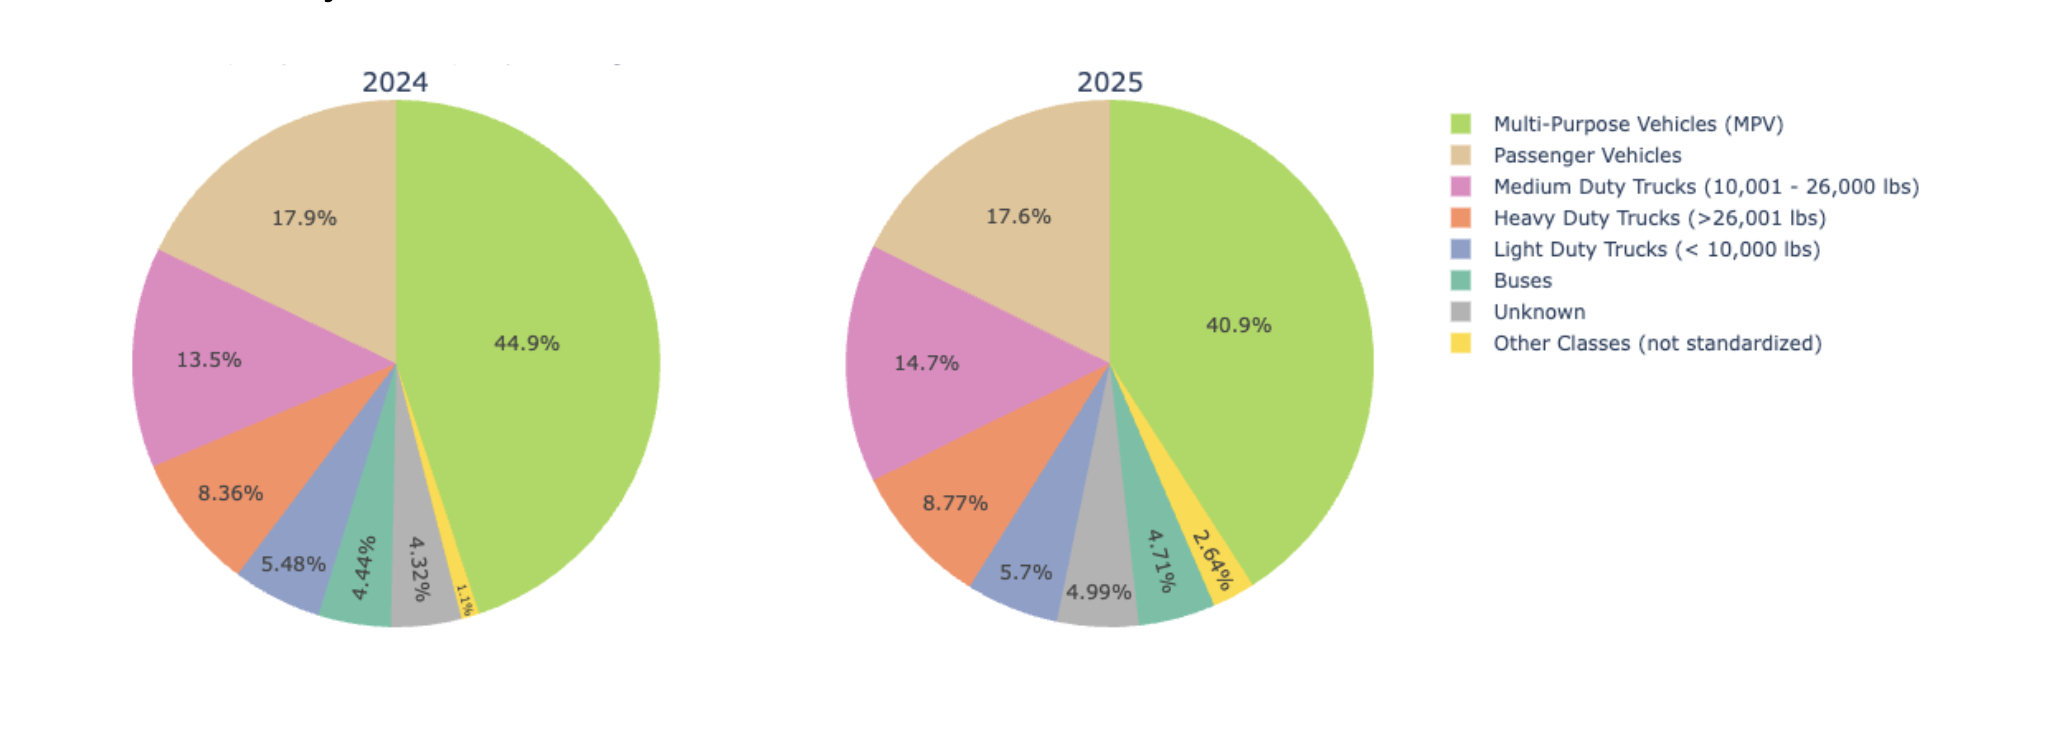
Figure 4: A comparison of vehicle type shows very little change after implementing congestion pricing.
Vehicle idling data presents a nuanced picture. When measured per vehicle, average daily idle time increased in 2025 compared to 2024. However, when we factor in the higher trip frequency, idle time per trip actually decreased.
This pattern holds consistently across both yearly totals and month-by-month comparisons. Commercial vehicles are idling less per delivery or service stop, but because they’re making more stops per day, their total daily idle time has increased slightly. This aligns with the operational shift toward more intensive use of vehicles that enter the zone.
While studies have found that air quality has improved in the vicinity of the congestion zone since the implementation of congestion pricing, our data suggests that this decrease may be caused by 1) more efficient movement on roads likely resulting in less mid-trip idling, and 2) fewer non-commercial vehicles.
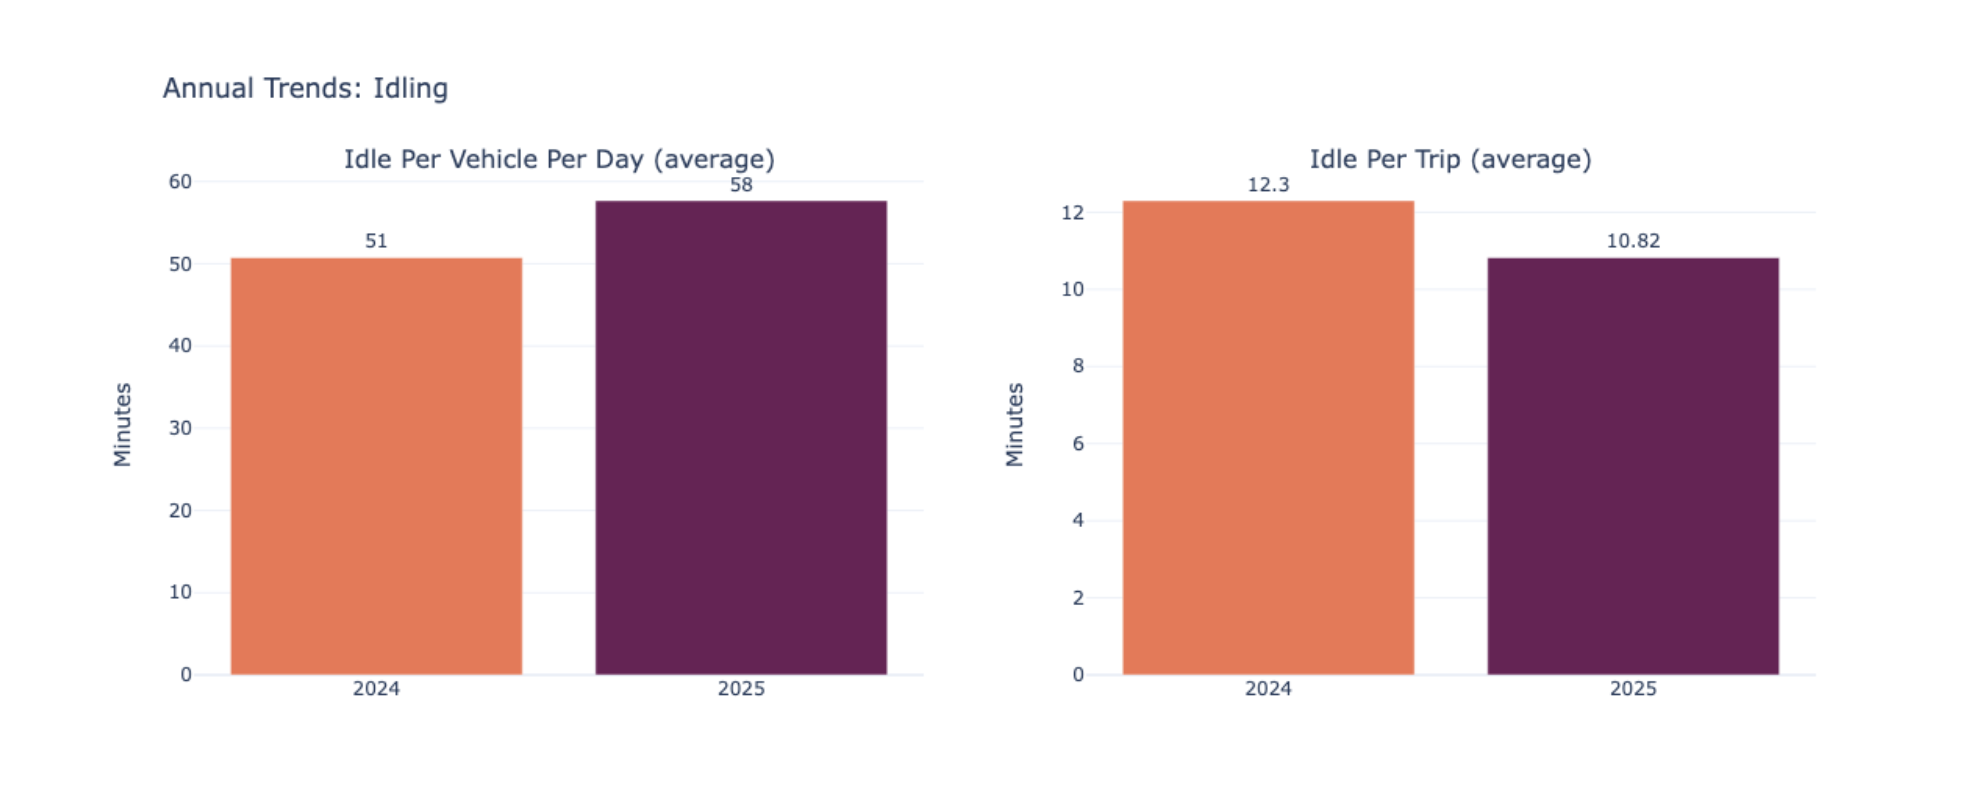
Figure 5: While commercial vehicles are idling less per trip in 2025, the increased trip volume creates more emissions compared to 2024.
One year into congestion pricing, commercial vehicle operators appear to be adapting rather than avoiding the zone entirely. The strategy seems clear: consolidate operations onto fewer vehicles but use those vehicles more efficiently. This could mean better route optimization, consolidated deliveries or extended operating hours.
As the program continues to evolve and operators further optimize their strategies, it will be important to monitor whether these trends continue, and whether the efficiency gains translate into measurable environmental and traffic benefits for the city.
How strong is your city’s freight economy? Get the Altitude Freight Efficiency Report to see which U.S. cities are leading the way in urban freight efficiency and which ones are falling behind.
When auto racing shut down the Las Vegas Strip, freight kept moving. See how data-backed special event traffic management planning kept the city’s supply chain intact.
A wake up call for Southern freight planning: Winter Storm Fern cut commercial vehicle movement by 54% in Dallas. See what the data reveals, and what Southern transportation planners must do next.
Learn how freight corridor analysis helps planners identify stressed routes, forecast deterioration, plan detours and build defensible strategies to win funding.