A planner’s checklist: What telematics data can (and can’t) do for freight planning
Telematics data for freight planning complements traditional sources. Our checklists share what telematics data can and can’t do to support freight planning.

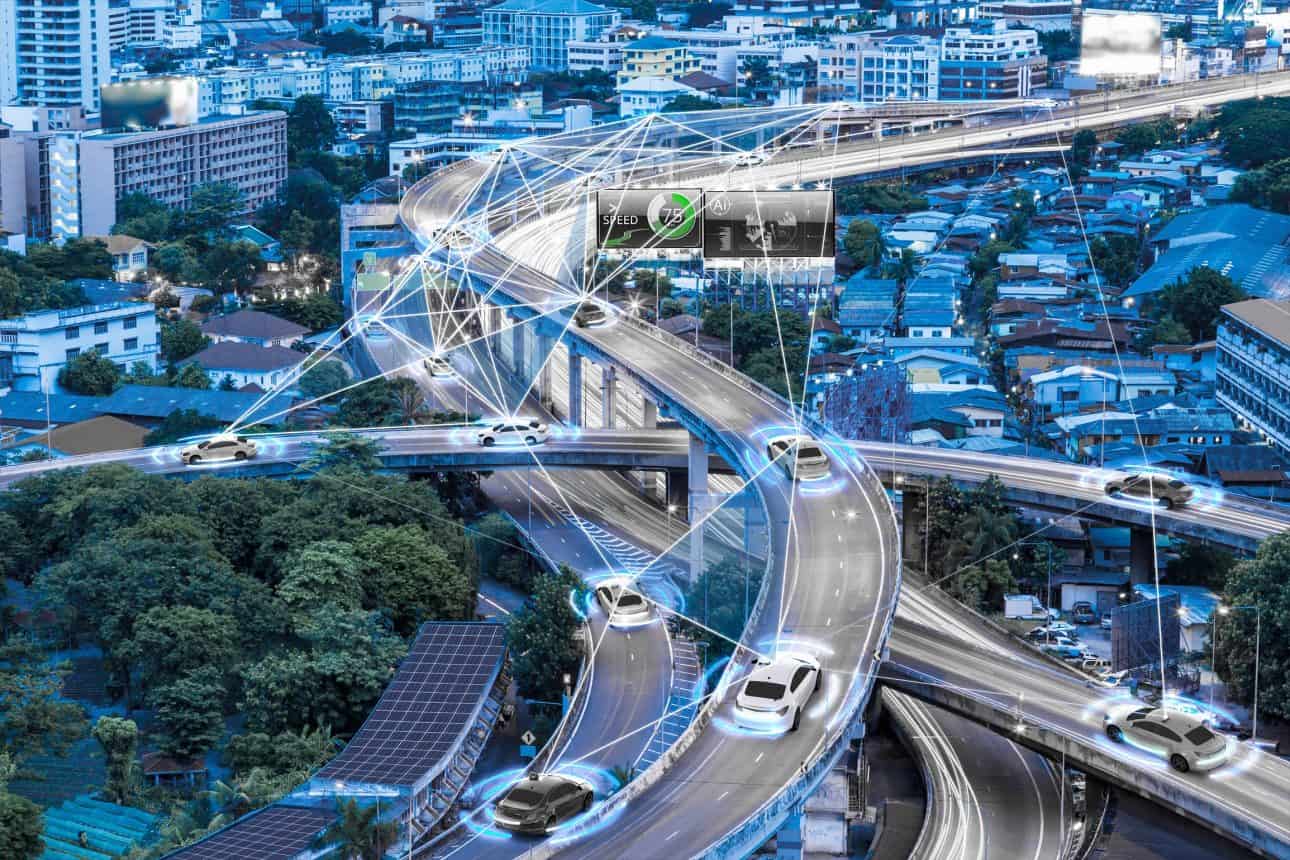
Connected vehicle data is information reported from a car or truck’s built-in technologies or a plugged-in vehicle hardware device. This information can include data about a vehicle’s position, performance, health and historical activities. Within the realm of connected vehicle data, a litany of powerful use cases exist that leverage these unique insights.
Connected vehicle data categories can also be used to understand holistic vehicle movement within a region. The individual vehicle metrics can be viewed in total at a bird’s-eye level, showing aggregate transportation trends. With contextual insights backing up these combined sets of connected vehicle data, planners, modelers and officials can survey real-world information to create more effective infrastructure and policy decisions.
Using a car’s internal sensing technologies or a third-party connected device, connected vehicle data can be pulled from across all of a car’s different sensors. This pulled data can be brought into a variety of different software solutions that enable users to study the insights visually, uncover inefficiencies in their operations and guide their management plans.
Aggregate connected vehicle insights illustrate what is happening on a city or state’s road networks. In addition to totaling the numbers of vehicles traveling and their various speeds, aggregate traffic data collection provides users with key information on origins and destinations. See the most common traffic bottlenecks in a particular region and where vehicles are headed to easily identify areas of improvement, how vehicles are interacting with one another and when traffic volumes are at their highest.
Altitude by Geotab offers these valuable freight and fleet data analytics with our expansive platform, Altitude. Using data from over four million of commercial vehicles and 26 million trips a day, Altitude takes true insights from each vehicle and aggregates them within a single solution. Our platform shows valuable road analytics like speeds and travel durations to paint a realistic portrait of an area’s overarching travel tendencies.
Conducting a traffic data analysis with Altitude enables you to make travel more efficient for vehicles in your area via new strategies based upon the insights. Whether building new electric vehicle (EV) charging stations, studying truck parking issues and adding new options or diverting traffic to different routes, a mixture of effective policy and infrastructure decisions built upon data can help you smartly develop your state.
See more: Discover our Incident Management use case to learn more about how our data demonstrates the results of traffic diversions. Witness this visual story by going to Traffic Operations on our Interactive Map.
Traffic data analytics that offer no context are limited because they obscure or neglect vehicles’ reasons for movement. Altitude solves this issue by adding key context to connected vehicle data, providing background insights on vehicle classes, vocations and more. These pieces of information help you determine the purposes behind vehicles’ choices in routes and which industries make up the bulk of your region’s commercial vehicle travel.
Contextual information like this is beneficial for transportation planners because it provides them with deeper knowledge beyond just simple data points. Understanding the industries and types of vehicles most commonly moving throughout a region helps planners create more specific solutions to the unique transportation challenges their particular states face. With context to base their infrastructure strategies on, they’re able to be more informed from the start of a new project and better position it for a successful outcome.
As the future unfolds, connected vehicle data will continue to lead the way for transportation planners and modelers during their projects. Whether approaching traffic-calming measures from the standpoint of policy or infrastructure, it’s clear that connected vehicle data will form the bedrock of states’ transportation plans. Altitude is dedicated to expanding its offering of aggregate vehicle movement insights to continue supporting DOTs, both now and during whatever lies ahead.
Learn more about the value of connected vehicle data by speaking with one of our experts today about Altitude.
Connected vehicle data is information reported from a car or truck’s built-in technologies or a plugged-in vehicle hardware device. It can include details on a vehicle’s position, performance, health, and historical activities, pulled directly from a vehicle’s onboard sensors.
Connected vehicle data is gathered using a vehicle’s internal sensing technologies or a third-party connected device installed in the vehicle. This data is then fed into software solutions where users can visualize insights, spot inefficiencies, and shape management plans.
Aggregated connected vehicle data gives planners a bird’s-eye view of regional traffic, including vehicle volumes, speeds, and origin-destination patterns. This helps them identify common bottlenecks, understand how vehicles interact on the road, and make more informed infrastructure and policy decisions.
Without context, connected vehicle data only shows that vehicles are moving, not why. Adding details like vehicle class and vocation helps planners understand which industries are driving traffic in a region, allowing them to design more targeted solutions for their area’s specific transportation challenges.
Telematics data for freight planning complements traditional sources. Our checklists share what telematics data can and can’t do to support freight planning.
New data sources for MPO freight planning: 3 overlooked metrics that reveal regional trends before they hit your dashboard.
State DOTs can forecast truck traffic earlier by watching freight metrics from city and port data. Here are 3 signals worth tracking.