Top truck ramp parking causes revealed
Learn how freight corridor analysis helps planners identify stressed routes, forecast deterioration, plan detours and build defensible strategies to win funding.


It’s an increasingly problematic planning paradox: America’s freight demands are climbing, even as our infrastructure continues to age out of its original service life. With limited budgets, growing travel and assets in worsening condition, agencies need sharper tools to build defensible improvement plans that win funding.
Corridor-level transportation metrics make that possible. By analyzing aggregated, privacy-protected movement patterns derived from over five million commercial vehicles, planners can prioritize projects and reroute during repairs and upgrades. This allows them to act before the next lane closure or bridge restriction cascades through the network.
Bridges and roads built 50 to 100 years ago are bearing heavier and more continual loads than their designers ever imagined, and the wear is showing. According to the American Society of Civil Engineers (ASCE), up to 39% of U.S. roads are currently rated in poor condition. Of the nation’s 623,000+ bridges, only 44% are rated good; the rest are rated fair or poor.
With a $3.7 trillion funding gap, competition for federal grants (like INFRA and RAISE) is fiercer than ever. Planners don’t just need to identify repairs; they need defensible evidence to win the funding to fix them.
Freight movement is expected to grow more than 25% from 2019 to 2030, according to the American Trucking Associations. To prepare, ASCE urges states to prioritize repairs for high-volume freight corridors and bridges serving evacuation or critical travel functions.
To identify which lanes meet those criteria, and win funding to repair them, planners need corridor-level insights that reveal where deterioration risk and freight demand intersect, including:
A Corridor analysis helps planners understand the impact of freight movement changes, before, during and after updates.
Before its collapse in March, 2024, the Francis Scott Key Bridge in Baltimore carried 12.4 million vehicles annually, many of them commercial. While the community continues to heal from the tragedy, the logistical fallout also carried a heavy price tag. The loss of this critical link cost the U.S. economy an estimated $15 million per day, according to the Maryland Chamber of Commerce.
Analyzing corridor-level trips before and after the bridge collapse reveals meaningful changes in commercial speeds, routes and trip volumes. Such insights can support emergency planning, enabling detour strategies that are feasible for heavy freight and minimize regional disruption.
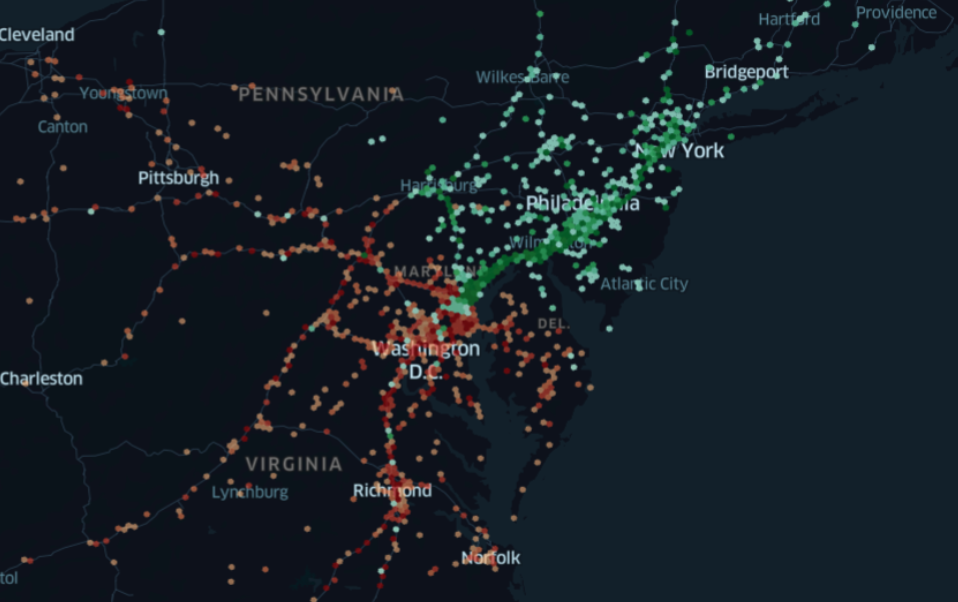
Figure 1: Altitude by Geotab’s Origin & Destination analysis maps full trips that passed through the Francis Scott Key Bridge before its collapse.
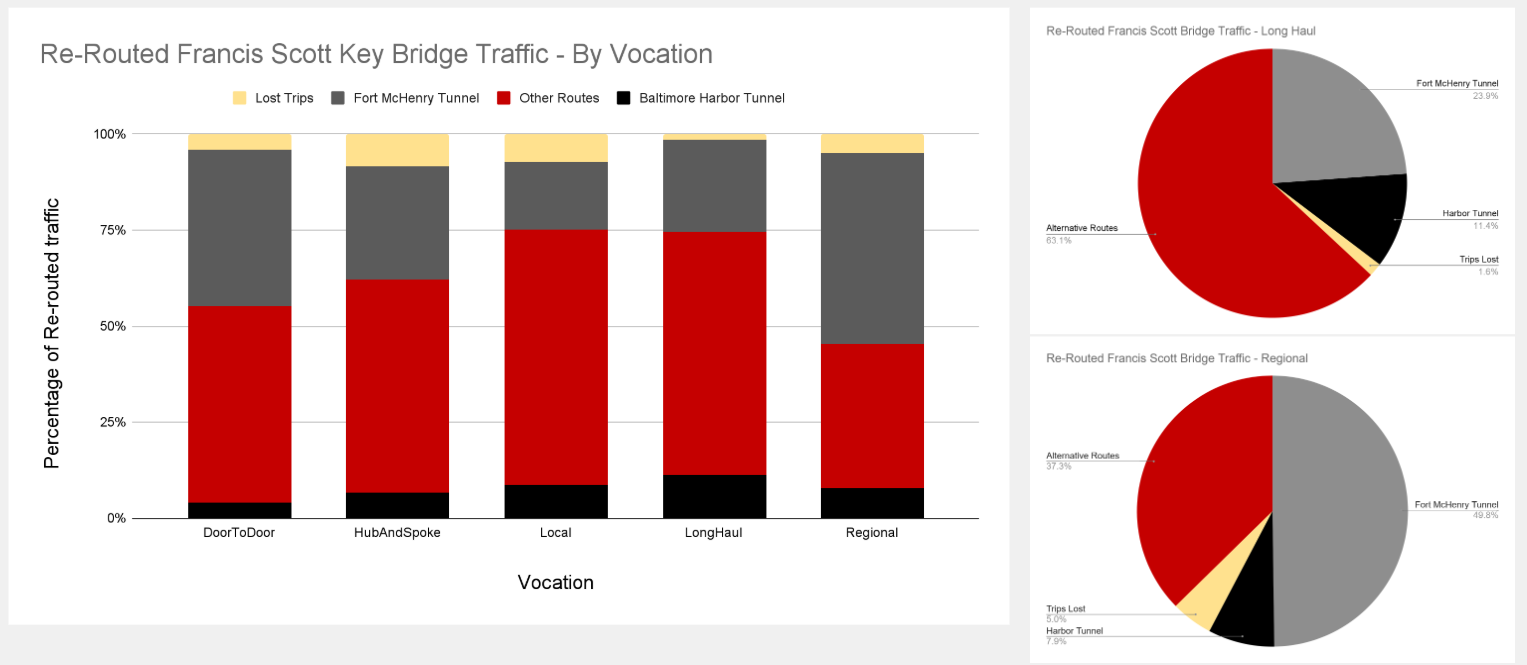
Figure 2: A Corridor Analysis of the Francis Scott Key bridge before and after its collapse reveals the freight travel impact on alternate routes.
Altitude’s Regional Travel Metrics are designed to give planners a clearer, more actionable picture of how freight uses key corridors today, plus how patterns change over time.
Daily and hourly trip counts reveal which corridors are absorbing the most freight traffic right now. With Altitude, planners can access validated Annual Average Daily Traffic (AADT) counts within 90 days of year-end—months or years faster than industry standards—allowing grant applications to be based on current realities, not outdated history. Planners can compare this activity to previous weeks, months or seasons to identify emerging stress points or shifting patterns tied to construction, growth or logistics changes. More trips typically means more wear, more congestion and more risk to aging assets.
VMT provides a daily average of how intensively each corridor is used over the past year. Comparing VMT year-over-year helps planners spot long-term trends (such as sustained increases in heavy-duty traffic) that directly influence pavement deterioration rates, bridge fatigue and long-term maintenance forecasts.
Not all freight trips create equal impact. Long-haul Class 7–8 vehicles contribute disproportionately to pavement degradation compared to smaller and lighter last-mile vehicles. Beyond asset stress, understanding the mix helps quantify economic value. By linking truck movements to specific industries (e.g., manufacturing, warehousing), planners can prove a corridor’s role in the regional economy, strengthening the “economic vitality” criteria in grant applications.
Together, these metrics supply the class-based, temporal detail needed to strengthen freight plans, support competitive funding applications and defend investment priorities to decision-makers.
As freight increases and infrastructure ages, Departments of Transportation (DOTs) and Metropolitan Planning Organizations (MPOs) cannot afford to rely on outdated assumptions. Corridor Analysis gives planners a data-backed way to:
America’s freight network depends on infrastructure that can meet today’s and tomorrow’s demands. With Altitude’s Regional Travel Metrics and Corridor Analysis, planners have the tools to support those investments are grounded in real-world data, not guesswork.
See how your priorities compare to the rest of the nation. We analyzed 50 state freight plans to uncover the top three challenges facing planners today: safety, infrastructure decay and congestion. Download the full eBook to see the data behind these trends and discover how validated analytics can help you design targeted, results-focused solutions for your region.
Learn how freight corridor analysis helps planners identify stressed routes, forecast deterioration, plan detours and build defensible strategies to win funding.
Pilot Company is leveraging Altitude’s mobility analytics to prioritize a landmark investment of over $1 billion in enhancing and modernizing their travel center network.
A data-driven analysis of commercial vehicle traffic patterns in San Francisco and Santa Clara during Super Bowl LIX.