Altitude provides an abundance of data to help your planners and modelers pinpoint unsafe areas in your transportation grid. They can then craft new strategies within an overall action plan that effectively target these inefficiencies and/or unsafe areas. Several key ways our platform can help you identify potentially unsafe activity include:
Studying aggressive driving behaviors. Altitude offers insights on speeding instances by vehicles traveling along key corridors. Our platform also offers an API that serves aggregated harsh driving event data, enabling planners to identify potentially problematic roadways. Examples of these harsh driving events include erratic cornering, brake slamming and aggressive accelerating.
Predicting and measuring traffic intervention impacts. Our Interactive Map’s New York City use case highlights a prime example of how Altitude’s data can help DOTs track the results of their traffic-calming interventions. These interventions can include strategies like speed cushions that demonstrably reduce instances of speeding on high-risk roads.
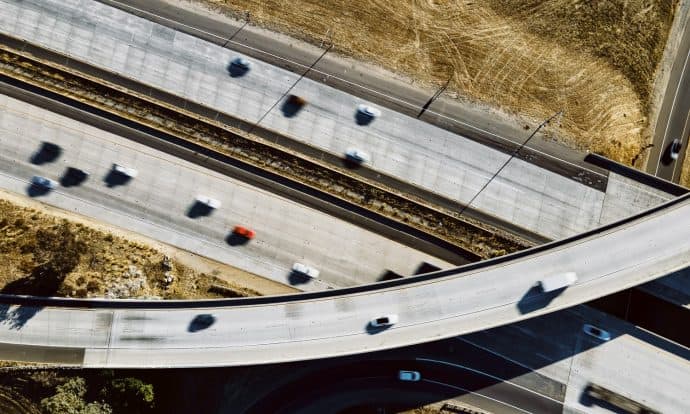
Pinpointing traffic bottlenecks. Many different reasons can exist for an area’s susceptibility to high traffic congestion. Examining these areas with context using our platform can help your agency determine whether bottlenecks are due to insufficient infrastructure, frequent accidents or other factors. By streamlining bottlenecks using measurement-based strategies, traffic flow and safety can be improved in your region.
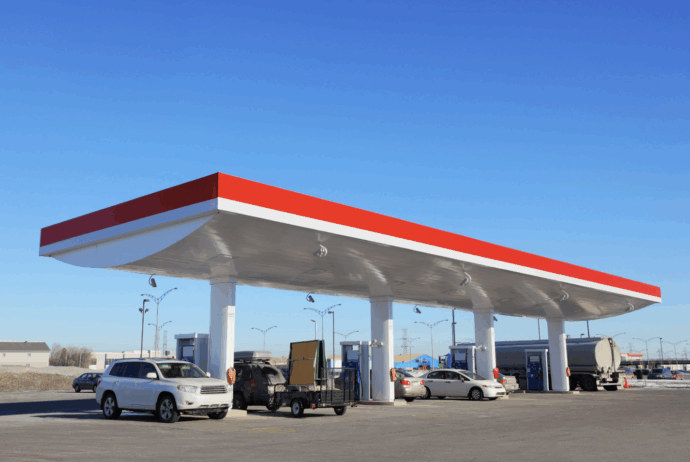
Analyzing parking trends and current curbside management. The role of parking is often neglected when motorist safety as a whole is discussed, but it’s even more relevant to mention when talking about commercial driving operations. Inefficient parking and poor curbside management can add more than just a headache to their daily work; it can result in safety concerns stemming from a lack of visibility, cramped spaces to maneuver their large trucks and potential stress over maintaining Hours-of-Service (HOS) compliance. Altitude uses a tandem of stop analytics and road metrics to help you understand how trucks are moving, where they’re frequently taking breaks and their total trip histories. With this information, you can devise new methods to improve parking and curbside safety by surveying the busiest areas and expertly choosing where to install more options.
Modeling route analytics for the purpose of sustainability. The end goals of sustainable transportation infrastructure are always to improve air quality and meet emissions targets. Using Altitude, you can rely on data to select the best places to put new electric vehicle charging stations, helping improve public health as a result. By supporting more drivers in the ongoing shift from internal combustion engine (ICE) vehicles to EVs with sustainable infrastructure, heavy-traffic regions can benefit from reduced air pollution. Preserving the long-term health of citizens with fewer greenhouse emissions from ICE fuel burn should be another key element of your safety action plan.


