No pit stop required: Special event traffic management planning
When auto racing shut down the Las Vegas Strip, freight kept moving. See how data-backed special event traffic management planning kept the city’s supply chain intact.

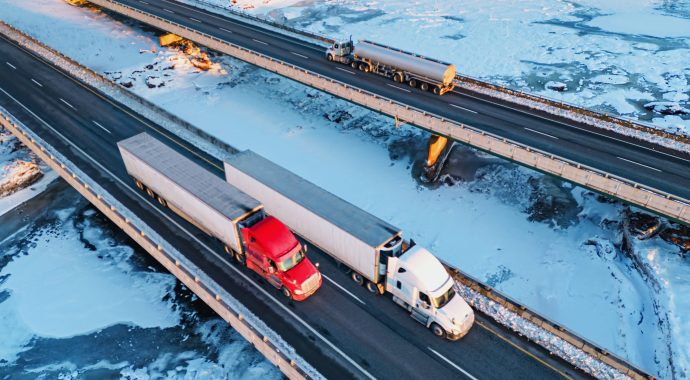
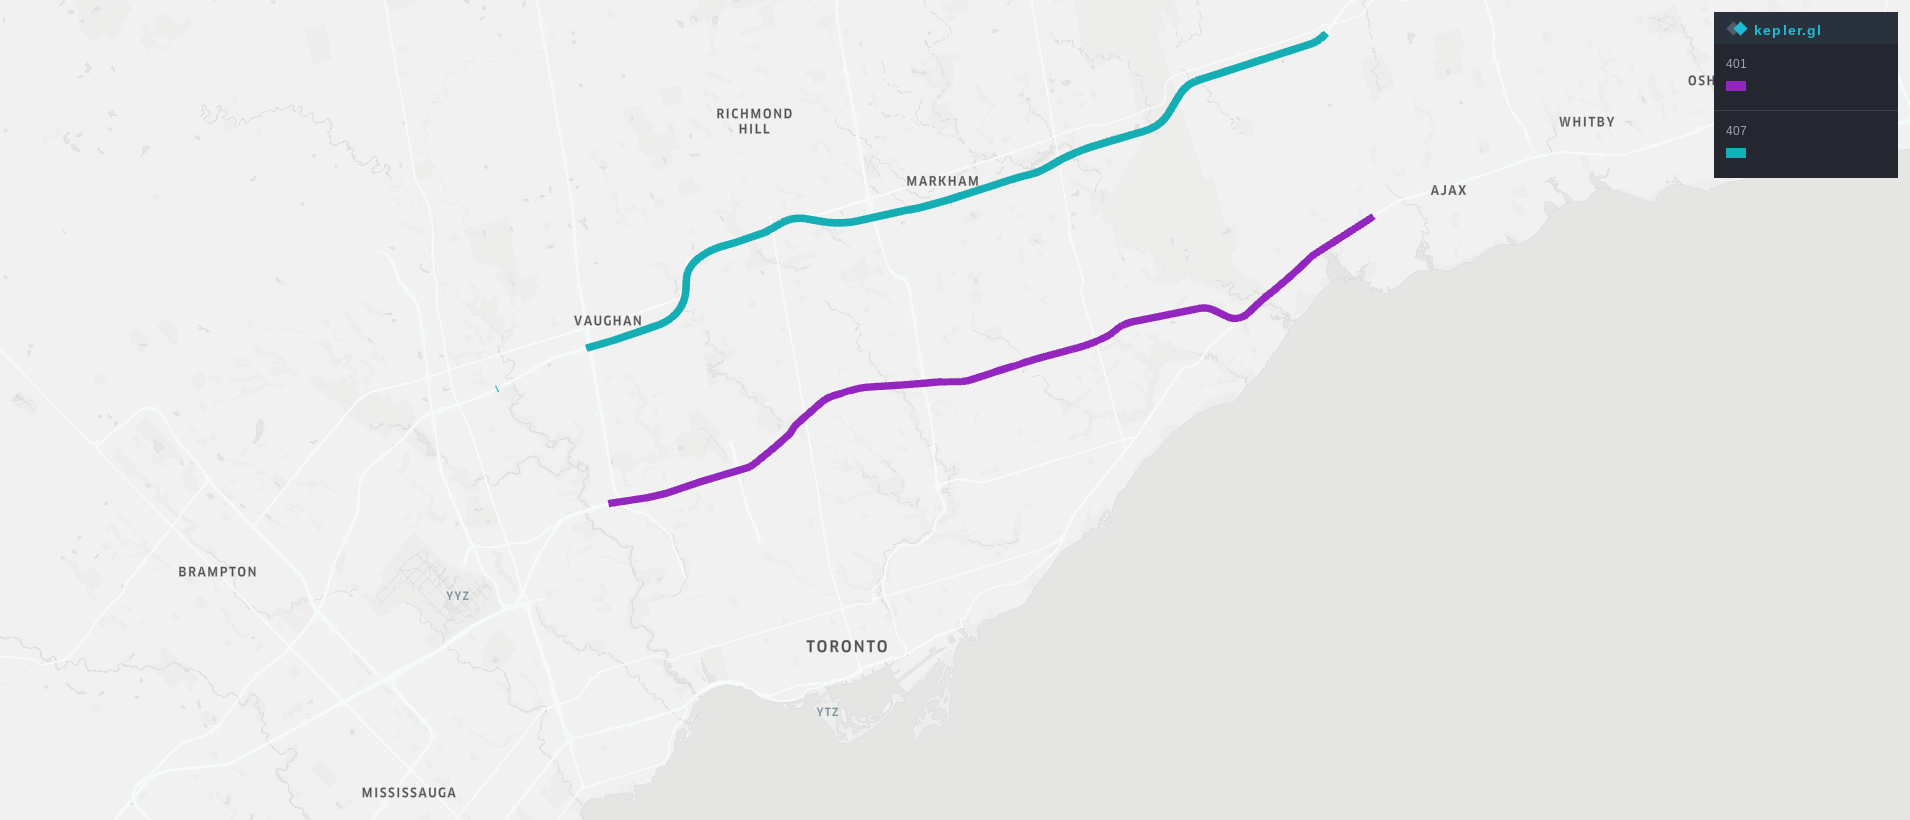
There are two major roadways running through Toronto: The 407 and the 401. The 407 is a privately operated and maintained toll highway, while the 401 is publicly owned highway and free to use. We investigated the driving experience on both roads in terms of travel time and costs with commercial vehicle data to understand exactly how different the two roads are.
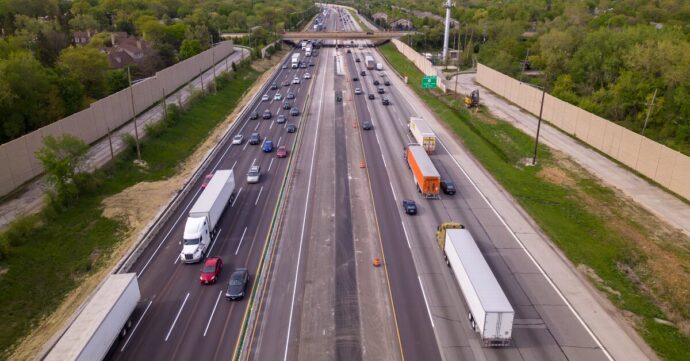
Express Toll Route 407 has long been a source of chagrin for drivers in the Greater Toronto Area. Initially built to alleviate congestion on the 401, the roadway has been at the center of several controversies since its opening in 1997. The controversies stem primarily from the low-cost sale of the road to private entities in 1999, followed by continual toll increases. Although the toll was initially proposed as a temporary measure to pay off the construction costs of the roadway (which was anticipated to have been completed by 2032), the current ownership structure has shown no signs of ending the toll. Today, many consider the 407 to be prohibitively expensive. The toll associated with the 407 keeps traffic moving at free flow speeds—even during peak travel hours—in stark contrast to vehicle movement on the 401, which is often at a standstill during rush hour.
It’s common knowledge that the 407 is faster and more expensive, while the 401 is slower and free, but we wanted to understand exactly how stark the difference between these two roadways really is. Using commercial vehicle data from Altitude by Geotab, we answered the following questions:
We first compared the two roadways by measuring the relative difference between speed limit travel time and average observed travel time. This metric allowed us to understand how vehicles are actually able to move under real congestion conditions, compared to an ideal scenario, where vehicles could travel at the speed limit. The relative difference is calculated as follows: (Observed travel time – travel time at speed limit)/Travel time at speed limit * 100
The image below shows how this relative difference in travel time varies between the 407 and the 401 on weekdays in 2024.
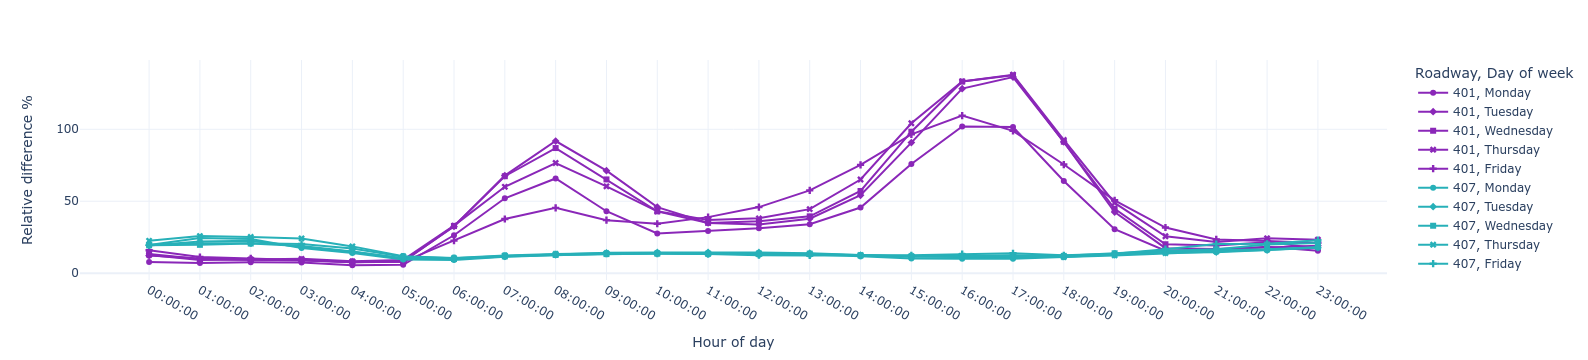
While both roadways performed relatively well during nighttime hours (9 p.m. – 5 a.m.), the 401 experienced congestion throughout the majority of the day, while movement on the 407 generally occurred at the speed limit, regardless of the time of day. These differences are especially stark during peak hours (8 a.m. and 5 p.m.), when vehicles on the 401 may spend as long as double the amount of time traveling the roadway compared to if they were moving at the speed limit. To further understand the impact of this congestion, we calculated the additional time spent in traffic annually for 401 weekday drivers. These results are shown in the table below. The time spent in traffic measures only the additional time drivers spent on the 401 due to moving at speeds slower than the speed limit (not the total amount of time spent driving).
| Time of day |
Total time spent in traffic annually (hours) |
| Peak morning (7:30-8:30 a.m.) |
113 |
| Peak evening (4:30-5:30 p.m.) |
216 |
| Early morning (5:30-6:30 a.m.) |
6 |
| Afternoon (2:30-3:30 p.m.) |
127 |
The tabulated results showed that drivers spend several hundred additional hours on the 401 annually because of congestion. While the worst of the congestion can be avoided in the morning by shifting driving to an earlier time, the afternoon congestion is more difficult to avoid. By comparison, drivers on the 407 often save time compared to the speed limit because the lack of congestion allows vehicles to move faster than the speed limit. However, drivers on the 407 have to pay a toll to take advantage of this congestion-free route. The toll costs to cross the section of the 407 shown in the image above are outlined in the table below. Costs are rounded and shown for vehicles with transponders.
| Time of day |
Light-duty vehicle |
Medium-duty vehicle |
Heavy-duty vehicle |
| Peak morning (7:00-9:30 a.m.) |
$49 CAD |
$71 CAD |
$97 CAD |
| Off-peak morning (6:00-7:00 a.m.) |
$43 CAD |
$62 CAD |
$85 CAD |
| Afternoon (2:30-3:00 p.m.) |
$46 CAD |
$67 CAD |
$92 CAD |
| Afternoon (3:00-3:30 p.m.) |
$47 CAD |
$68 CAD |
$93 CAD |
| Evening (3:30-6:00 p.m.) |
$53 CAD |
$77 CAD |
$105 CAD |
Toll costs were highest during peak evening time, which corresponds with the time of day that the 401 experiences the worst congestion. If we consider a scenario in which a vehicle takes the 407 during weekday evenings instead of the 401 in order to save 216 hours per year of time that would otherwise be spent in traffic, that vehicle faces that following annual toll costs:
For some, these costs may be worth the time savings. In essence, light-duty vehicles pay $62 per hour of saved time, while heavy-duty vehicles pay $122 per hour of saved time.
Learn more: Discover how congestion or roadway shutdowns can impact broader regional vehicle movement by reading our “Bridging the Data Gap” ebook.
The consequences of congestion go beyond time lost, especially when it comes to heavy-duty vehicles. While all internal-combustion engine powered vehicles emit greenhouse gases, heavy-duty vehicles emit at a higher rate than small vehicles and their emissions are more strongly influenced by the speed at which they are moving. Because of this, congestion on the 401 causes heavy-duty vehicles to emit at a higher rate than they would on the 407. Nitrogen oxides (NOx) are one type of greenhouse gas that are emitted from gasoline and diesel engines. Research from the International Council on Clean Transportation has found that heavy-duty truck NOx emissions are 10 times higher when trucks are going between 1 and 40 kilometers per hour (kph), compared to when the trucks are moving at speeds greater than 50 kph. On uncongested roadways, big trucks are typically able to travel at higher speeds, but our data shows that big trucks traveling on the 401 are going less than 40 kph for about a third of their trips when they are traveling during evening peak hours. This means that heavy-duty trucks driving on the 401 are emitting NOx at far greater rates than comparable trucks on the 407 since those trucks on the 407 are able to move at higher speeds.
Drivers traveling on the 401 through Toronto have a vastly different experience than those driving on the 407. Drivers on the 401 can expect weekday congestion when driving anytime between 5 a.m. and 9 p.m., while those on the 407 can generally expect to drive at the speed limit. Peak congestion can cause such low speeds that drivers spend double the time traveling on the 401 compared to if they were able to drive at the speed limit. To avoid this congestion, drivers can expect to pay at least $40 CAD or as much as $105 CAD to travel on the 407, depending on the time of day and size of their vehicle. Furthermore, congestion on the 401 has widespread emissions implications, especially for heavy-duty vehicles that emit at higher rates when driving at low speeds.
Through reliable traffic insights we’ve surfaced like these, Altitude by Geotab can help your municipality make sense of its unique vehicle movement patterns and take action. With accurate data on the state of your roads, you can create new infrastructure or policies to calm traffic and foster smoother transportation throughout your region. We’re committed to supplying governments and organizations alike with the insights they need for safer, more sustainable and more economical mobility.
If you have anecdotes or follow-up questions about this story, we encourage you to reach out to us!
When auto racing shut down the Las Vegas Strip, freight kept moving. See how data-backed special event traffic management planning kept the city’s supply chain intact.
A wake up call for Southern freight planning: Winter Storm Fern cut commercial vehicle movement by 54% in Dallas. See what the data reveals, and what Southern transportation planners must do next.
Learn how freight corridor analysis helps planners identify stressed routes, forecast deterioration, plan detours and build defensible strategies to win funding.