Skip to Main Content

What is vehicle miles traveled data and why is it crucial for strong transportation planning efforts?

Analyzing vehicle miles traveled by commercial trucks, buses and vans gives transportation planners valuable insight when enhancing regional movement.

Vehicle miles traveled (VMT) data is essential for state departments and transportation agencies when identifying the best ways to enhance regional infrastructure. Leveraging unique data types, VMT insights enable planners and policymakers to remain in tune with the travel tendencies of vehicles in their states. This article will define what VMT data is, how it can be used to problem-solve during each phase of a new transportation project and where expansion factors intersect with it.

What is VMT data?

Vehicle miles traveled (VMT) data points are holistic insights that explain the entirety of vehicle travel within a given region. Specific date ranges are established to help researchers compare how their region’s VMT analytics change over time. In the context of commercial or freight travel, VMT data shares movement insights on vehicles in categories like light-duty, medium-duty and heavy-duty trucks, as well as buses and other multi-purpose vehicles. 

Commercial VMT data presents distinct insights that can be used to diagnose the state of your region’s transportation network. Based on these analytics, leaders can efficiently identify how freight flows throughout their area’s highways and roads. Once they’ve assessed where their transportation plans currently stand, regional agencies are empowered to dive deeper into their commercial VMT data to solve the specific challenges they’re witnessing.

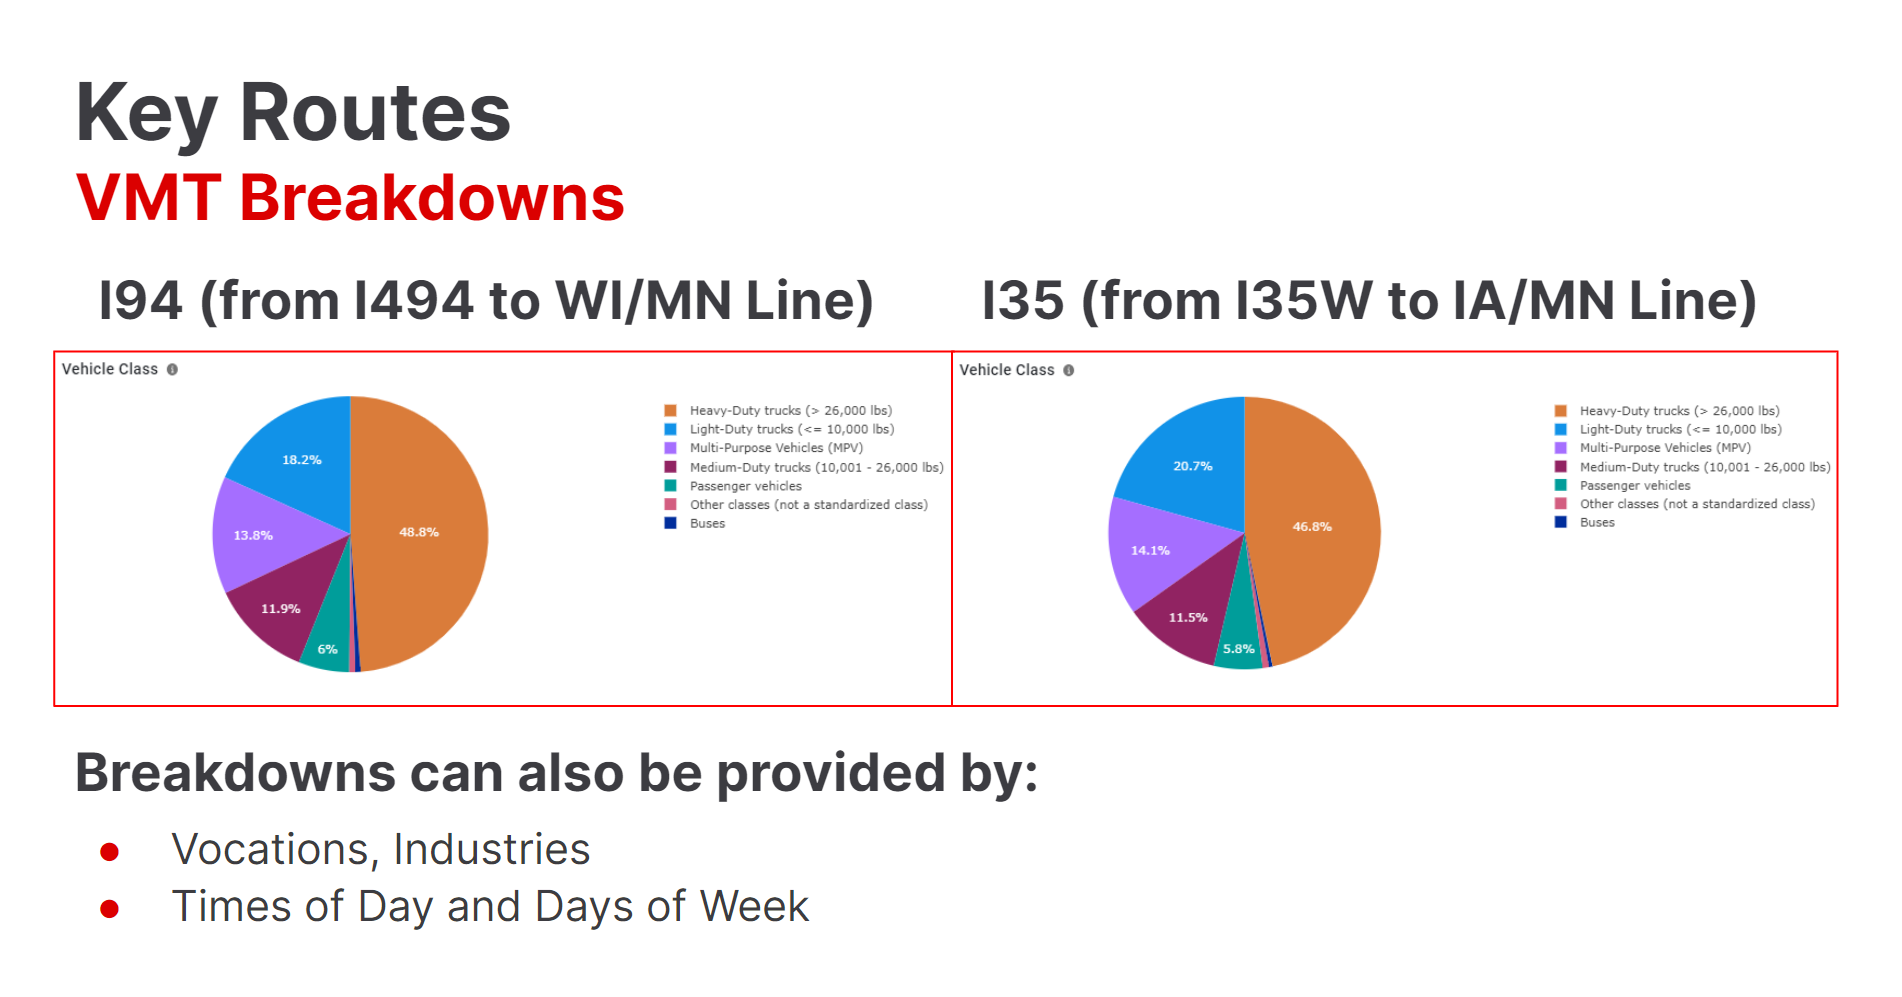
An example of two interstate VMT breakdowns in the Midwestern United States, with key distinctions in vehicle classes being found.

How can VMT data be used?

VMT data offers value beyond simply helping planners and policymakers diagnose the underlying issues in their transportation networks. These insights can be used to measure the results of newly enacted policies or constructed infrastructure, giving agencies validation that an initiative was successful. Conversely, VMT data can be used to understand if a recently implemented traffic solution could be refined more. By enabling transportation departments to constantly compare results, VMT data exposes what isn’t working and what is. These critical findings can be carried into future project strategies, helping regions become more efficient and effective in their transportation planning processes.

Examples of using VMT data for transportation planning include guiding the construction of new electric vehicle (EV) charging infrastructure, knowing the best areas to strategically place new parking options for commercial vehicles and building new roads to alleviate bottlenecks. New policies to improve movement can similarly be built on VMT findings, such as traffic diversions, incentivizing EVs or offering programs for regular toll road users.

What are the various categories of VMT data?

Within Altitude by Geotab’s Altitude product, our VMT data spans three primary data types: Stop Analytics, Origin & Destination data and Regional Travel Metrics. These distinct categories each tell a different story about a region’s commercial vehicle travel and can be leveraged in powerful ways to enhance transportation efficiency.

Stop Analytics: With Stop Analytics, you’re treated to an aggregate view of where commercial vehicles are parking in your region most frequently. In addition to identifying the mapped locations of these hotspots, you can dig into the deeper meaning behind why these vehicles are stopping there via vehicle class, vocation, fuel type and industry designations.

Stop Analytics data can be used to enhance a region’s sustainability and efficiency by helping to guide new EV infrastructure sites. Seeing where commercial vehicles are most commonly stopping helps planners zero in on potential new locations for chargers and identify their requirements. In crowded urban areas where curb space is a premium commodity, pinpointing where trucks are most frequently trying to park helps spur cities to act and make more effective use of the available space. Improved curbside management ultimately increases public safety and makes it easier for commercial drivers to do their jobs.

Origin and Destination Data (O&D): Gaining insight into where vehicles are coming from and where they’re headed through O&D data provides even more detail into trip characteristics. See the most frequently traveled routes from point A to B to visualize how traffic flows throughout your region.

O&D data can be used to improve transportation efficiency with both broader and more granular traffic insights. On a smaller scale, insights around curbside pickups and last-mile deliveries give planners ways to study traffic’s effect on shorter trips. On a macro level, highway trip data sheds light on how backups and bottlenecks affect the vehicle movement across state lines. By using O&D data to analyze smaller and larger transportation trends, agencies can concurrently solve the diverse challenges their transportation networks face.

Regional Travel Metrics (RTM): Our RTM API can help transportation agencies study average vehicle movement in terms of both volume and distance traveled. Important insights like idling duration are also reported through the API, giving planners an extra layer of insight to design new strategies from.

RTM analytics help planners attack transportation challenges from both a sustainability and an efficiency standpoint. Key travel metrics like average vehicle volume, idling trends and total distances can help agencies choose optimal locations for new infrastructure and create smarter freight plans. As higher than normal numbers can be symptomatic of underlying issues, agencies can use these indicators to create a truly informed action plan. 

Fuel station and truck stop corporations can also rely on RTM insights to help them identify potentially more profitable places to build new locations. Growing their companies by putting new truck stops, stores or fuel stations near high-traffic corridors or locations where competition is scarce can result in greater business collected.

How Altitude by Geotab's VMT data intersects with Expansion Factors

As our VMT insights are based strictly on commercial freight and fleet data, it’s important that we measure our data against an outside source so we are confident in its efficacy. Using our expansion factors, we’re able to speak for a region’s entire commercial vehicle movement based on the data we’ve collected from a fractional sample size. Our VMT expansion factors are compared to FHWA ground truths and we base our insights on data collected from roughly four million commercial vehicles. With expansion factors and our comparison model, VMT data from Altitude by Geotab is reliable, accurate and detailed.

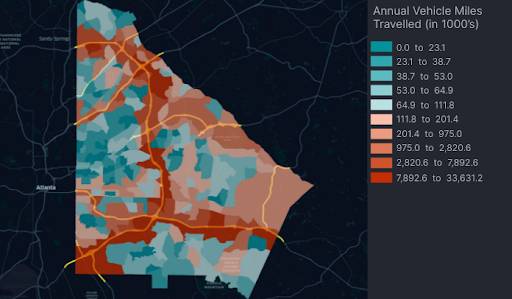
An example of a heatmap showing VMT averages in DeKalb County, Georgia. Using a statewide expansion factor, the VMT data was extrapolated across the entire region.

Getting started with a VMT analysis

To begin your VMT journey, look no further than Altitude. Our platform is built with all the deep, contextualized insights your project’s analysis will require. Whether you’re from a transportation agency or a business, the use cases of VMT data are virtually endless to help your organization achieve its strategic objectives. Start today by reaching out to one of our solutions experts today.

Recent news & releases

New Study Reveals State-by-State Safety Benchmarks: Altitude by Geotab Presents Insights at TRB 2025

Altitude by Geotab, formerly Geotab ITS, has released a new study identifying U.S. states with the highest roadway safety risks based on harsh driving events. The study found that West Virginia and Alaska had the highest rates of harsh events for heavy-duty trucks, while Illinois and Nebraska had some of the lowest rates for light-duty trucks. Altitude will be showcasing these findings and their rebranded platform at the TRB Annual Meeting from January 5-9, 2025, in Washington, D.C..