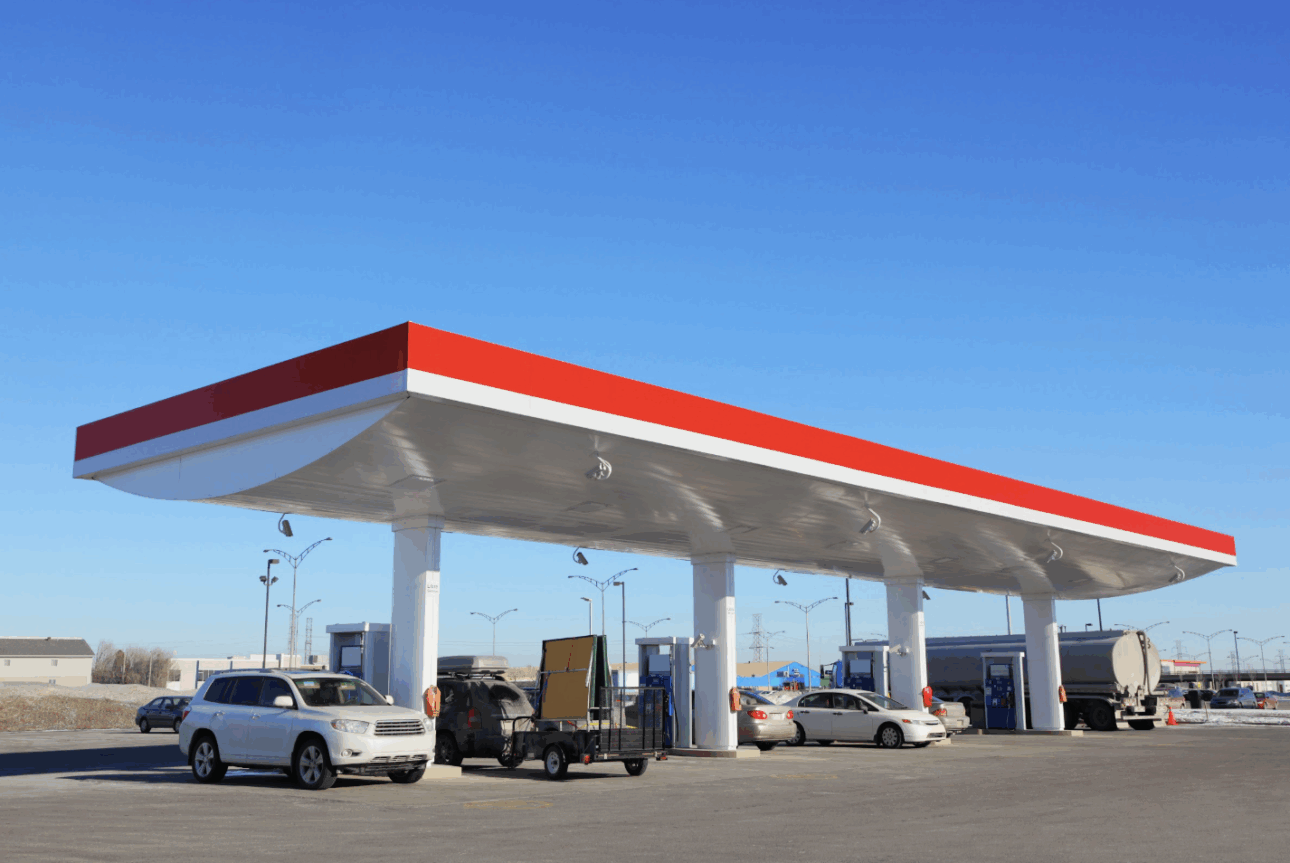
The best opportunity for gas station profitability is likely not a new location. It resides with the customers who are already under your canopy. Every day, your highest-value drivers fuel at your site and make additional purchases. The question is: are you capturing their full value?
Fleet and commercial drivers are the most reliable source of repeat revenue in fuel retail. Their routes are consistent, their fueling patterns predictable and their ancillary spend disproportionately high. Yet many networks still overlook this group in favor of chasing new sites or retail drivers.
By making evidence-based improvements at existing locations, using up-to-date, aggregated, anonymized commercial vehicle movement insights and observed on-site behavior, you can deliver a faster, more sustainable return than network expansion alone.
Start with a blueprint for on-site optimization
A strong profitability strategy begins with knowing where your existing network can perform better. Instead of adding new locations, focus on optimizing how each site functions day to day. Small, evidence-based adjustments often deliver faster, more reliable returns than expansion.
Use Regional Travel Metrics to identify high-value corridors (VMT, vehicle & trip counts), then apply Route Analytics (OD) to prioritize sites along those flows. This structured approach ensures every site operates efficiently and captures the full value of the commercial demand already under your canopy.
Turn idle hours into profit through commercial demand
Time influences every part of site performance, yet it is rarely treated as a profit driver. Each visit carries a pattern that can be measured, predicted, and improved. When operators understand how long drivers stay and when they choose to stop, they gain control over one of the simplest ways to grow margin.
While most consumer drivers refuel during the middle of the day or early evening, movement data shows that commercial drivers often prefer to refuel during early morning and late-night hours. They often target quieter periods with shorter queues, which correspond with overnight demand windows that are shaped by schedules and rest requirements.
Another consideration is how Federal Hours of Service (HOS) rules shape commercial driving patterns. These limits on driving, along with mandatory rest periods, create consistent demand windows for fueling and parking.
Fatigue risk peaks between midnight and 6 a.m. As a result, many drivers plan stops for rest and refueling during those hours. The electronic logging mandate also adds to that predictability by requiring drivers to stop earlier to secure parking before their hours expire.
By acting on these patterns, you turn predictable behavior into profit. When staffing, cleaning, and food preparation follow the same rhythm as your commercial drivers, quiet hours become productive ones. That operational alignment turns compliance-driven stops into consistent revenue and keeps your site performing at its full potential.
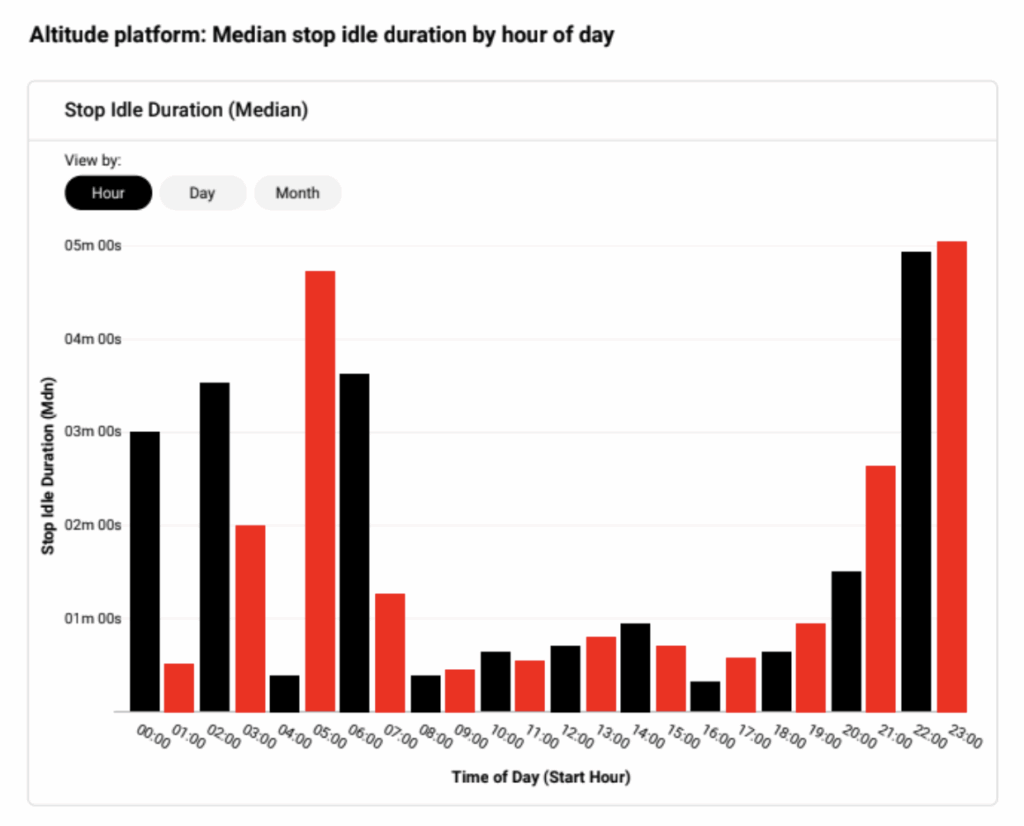
Reviewing key metrics like idling activity is crucial for identifying correlations with in-store purchases and understanding potential ancillary revenue. Source: Fueling smarter growth, Altitude by Geotab.
Unlocking Ancillary sales from commercial drivers
Fuel drives traffic, but what happens after the pump drives profit. Ancillary sales deliver more substantial margins than fuel and turn every visit into a chance to grow total revenue, particularly if you cater to your long-haul customers.
A fuel retailer report from Altitude by Geotab found that long-haul drivers spend around $30 a day on food, compared with less than $8 for consumer drivers.
However, ancillary sales go beyond just food.
Long-haul drivers spend more time on the road than any other customer, so every stop must meet more than one need. They look for a place to refuel, rest, and recover before the next leg of a route. When your site offers the right mix of essentials, each visit can generate several layers of revenue beyond fuel.
Parking is a foundation, as many drivers plan their day around finding a safe space before reaching their rest limit. Reliable, well-lit, easy-to-access parking is a major selling point. Add clean showering facilities and you have turned your location into a standard destination.
To fully understand where to place high-value amenities, you first need to see where drivers spend the most time on your site. Altitude’s Stop Analytics Module shows how commercial vehicles use your Site Zones on and around the property (e.g., canopy vs parking areas). The platform’s hex-grid visualization maps movement and dwell patterns within a defined site zone, showing exactly where drivers stop and how long they stay.
You can zoom in to see performance under the canopy, in parking areas, or near store entrances. These insights reveal how different parts of a site are used, helping guide future layout and service decisions based on real customer behavior.
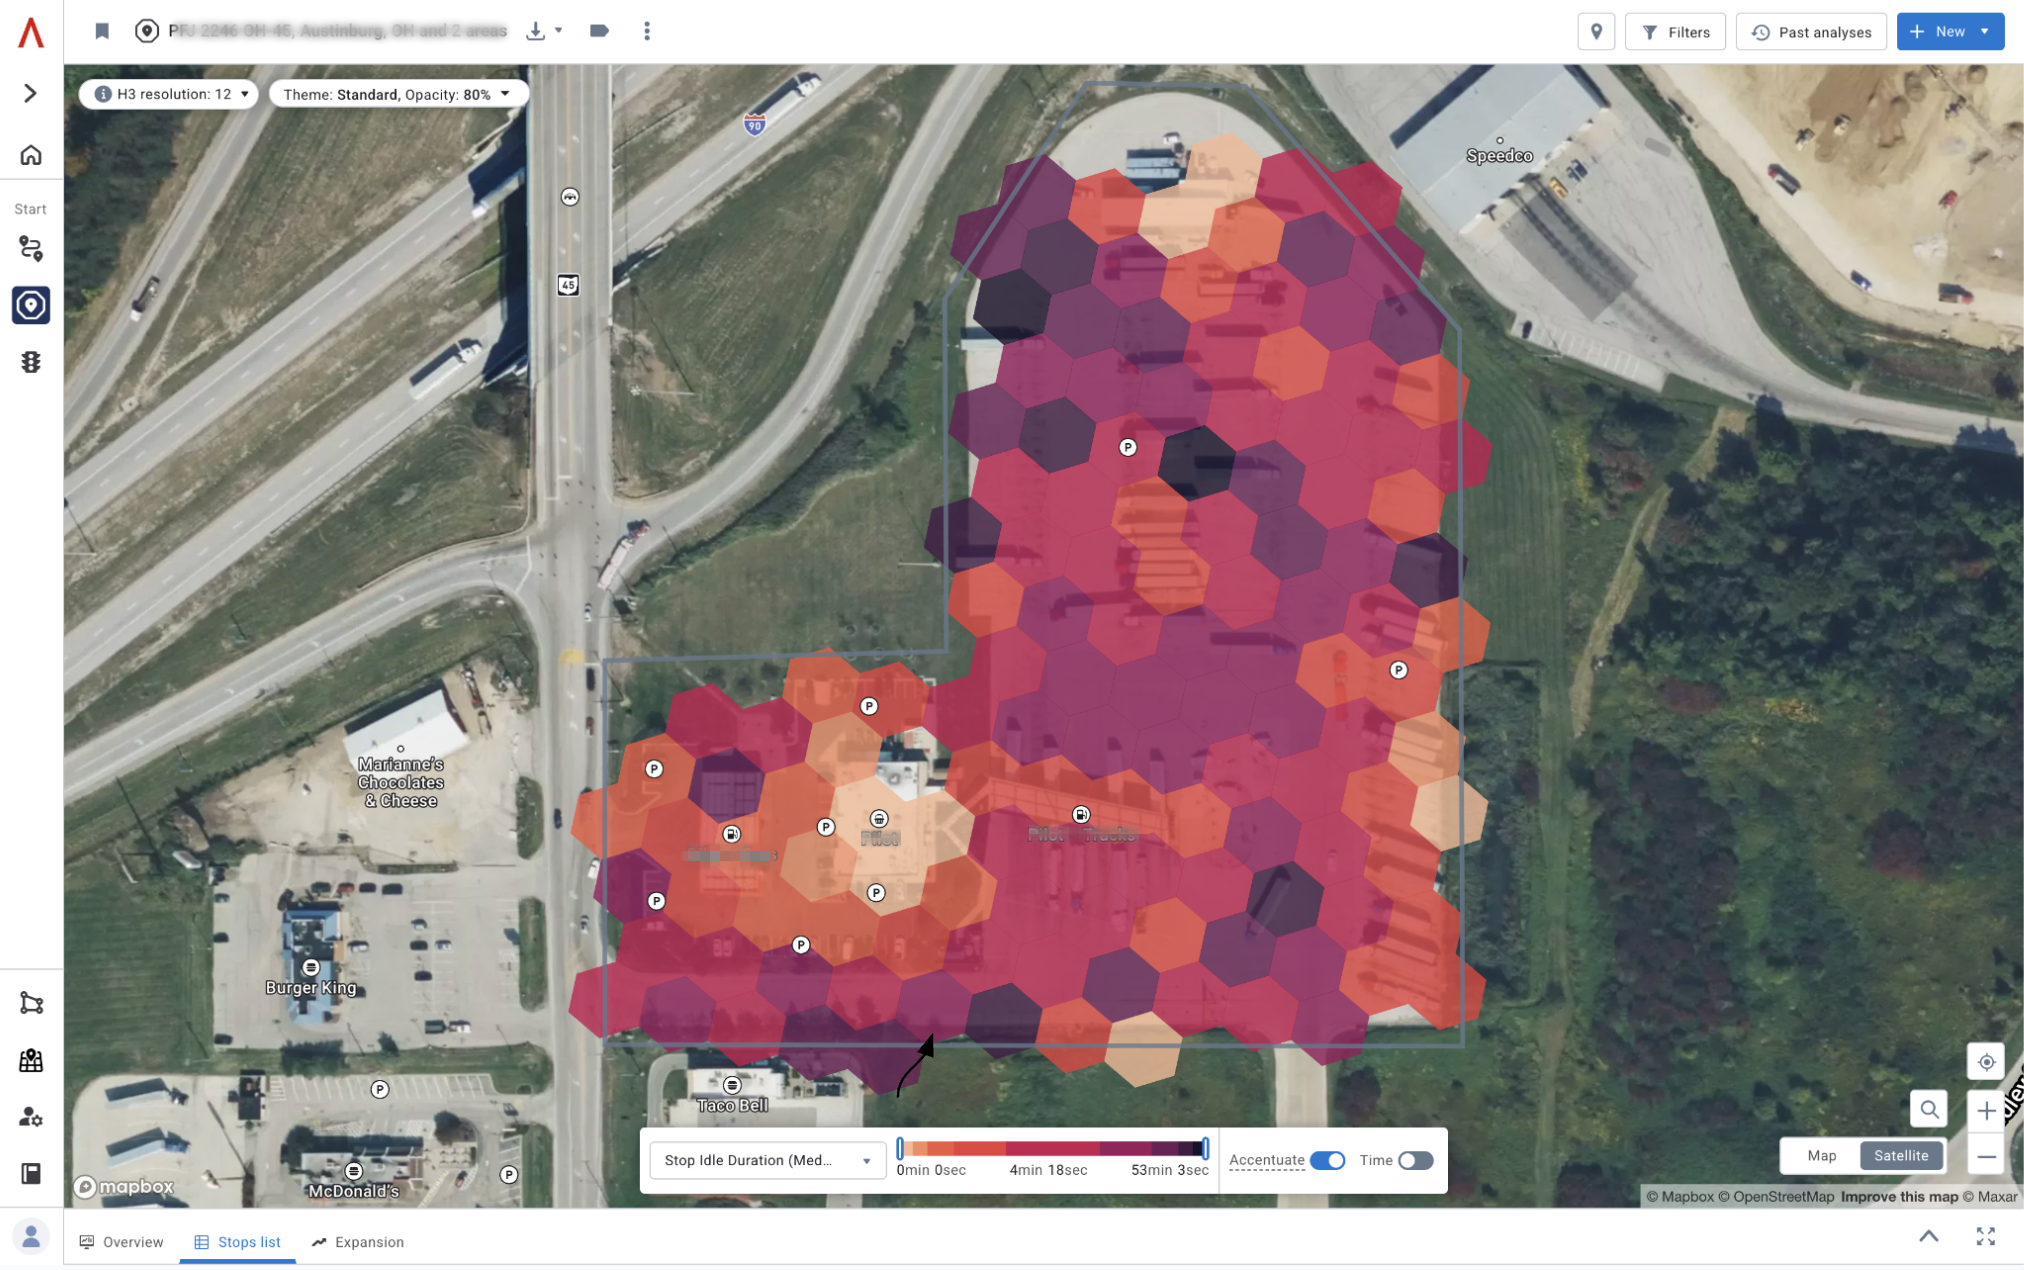
Altitude’s stop analytics can display a satellite map of a commercial property with a color-coded hexagonal grid to show commercial vehicle stop activity within the defined site zone. Source: Fueling smarter growth, Altitude by Geotab.
See how small changes can make a large difference
Gas station profitability grows fastest when small, targeted improvements compound across a network. Every site has underused potential that can be unlocked by improving efficiency and converting more of the drivers who already stop. The goal is to make each visit more valuable without adding new infrastructure.
A clear return-on-investment (ROI) framework starts with two levers. The first is operational efficiency, which focuses on using space, time, and labor more effectively. The second is ancillary revenue, which comes from increasing what each customer spends once they are on site. When these work together, even minor adjustments can deliver measurable financial gains.
The model is simple. If a location converts just ten percent more of its existing truck traffic into an in-store purchase, the lift can reach hundreds of thousands of dollars in new annual margin. Most of that revenue comes from the mentioned high-margin categories like food, personal care, or paid amenities. These changes cost little to implement yet deliver long-term value.
Measured this way, ROI is not a one-time calculation but a continuous process. Every hour saved and every additional purchase contributes to the same result: stronger gas station profitability through smarter on-site optimization.
Stop leaving money on the table
The opportunity for greater gas station profitability is already built into your existing sites. Commercial drivers bring predictable demand and consistent volume, but the full value of those visits depends on how well you serve them. By using up-to-date, aggregated, anonymized commercial vehicle movement insights to refine every part of site performance, you turn routine stops into steady growth.
Each improvement compounds across your network, creating higher revenue from the customers you already have. When operations, amenities, and inventory all reflect the needs of commercial drivers, you unlock lasting profitability and position your business for long-term advantage.
There’s gold is under your canopy. All you need to do is look.