Skip to Main Content

Super Bowl LX Traffic Impact: How America's Biggest Game Affects Urban Mobility

A data-driven analysis of commercial vehicle traffic patterns in San Francisco and Santa Clara during Super Bowl LX

The Super Bowl isn’t just the biggest sporting event in America—it’s a massive logistical challenge for host cities. Our analysis of commercial vehicle traffic data reveals significant increases in roadway activity around Super Bowl LX venues, with some zones seeing traffic volumes jump by over 70% compared to baseline periods.

By analyzing telematics data from commercial vehicles in defined zones around each venue, we quantified exactly how the Super Bowl impacts urban transportation networks. The results show clear patterns: the closer to the venue, the greater the impact.

Key Findings

New Orleans 2025: The Superdome Zone

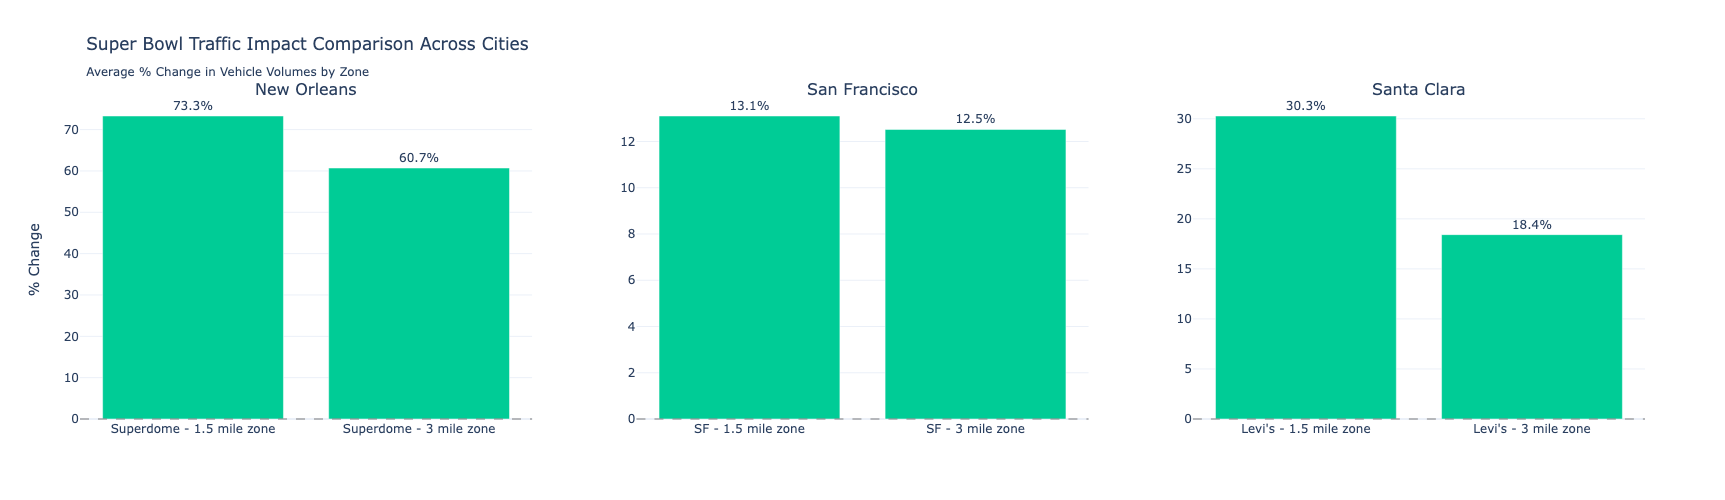
The Big Easy faced the biggest traffic surge of all three cities.

  • 1.5-mile zone around the Superdome: +73.3% increase in vehicle volumes
  • 3-mile zone around the Superdome: +60.7% increase in vehicle volumes

New Orleans, the 2025 Super Bowl host, experienced the most dramatic traffic increases. The immediate area around the Superdome saw nearly three-quarters more commercial vehicle activity during the Super Bowl period compared to typical January traffic. Even the broader 3-mile zone maintained a substantial 60%+ increase, demonstrating how the event’s impact radiates outward from the venue.

This surge reflects the enormous logistical footprint of the Super Bowl—from media trucks and catering services to merchandise deliveries and infrastructure support. For a city known for its compact downtown and historic street grid, managing this level of additional traffic presents unique challenges. 


San Francisco 2026: Moderate but Measurable Impact

The City by the Bay saw more modest increases, likely because SF proper did not host the game.

  • 1.5-mile zone around downtown SF: +13.1% increase in vehicle volumes
  • 3-mile zone around downtown SF: +12.5% increase in vehicle volumes

W San Francisco’s traffic impacts were significantly lower than New Orleans, which makes sense given that the game was played at Levi’s Stadium in Santa Clara, about 40 miles south. However, the double-digit increases still reflect San Francisco’s role in the broader Super Bowl experience—hosting media events, fan activities, and serving as a base for visitors exploring the Bay Area.

Interestingly, the 1.5-mile and 3-mile zones showed nearly identical increases, suggesting the impact was distributed relatively evenly across the measured area rather than concentrated at a specific point.


Santa Clara 2026: Levi’s Stadium Zone

Home of the 49ers and Super Bowl LX saw substantial increases, particularly close to the stadium.

  • 1.5-mile zone (levis_1point5): +30.3% increase in vehicle volumes
  • 3-mile zone (levis_3): +18.4% increase in vehicle volumes

As the actual game venue, Levi’s Stadium and its immediate surroundings experienced significant traffic increases. The 30% surge in the 1.5-mile zone reflects the intense activity directly around the stadium—team buses, broadcast equipment, security vehicles, catering operations, and last-mile deliveries all converging on game day and throughout Super Bowl week.

The drop-off from the 1.5-mile to 3-mile zone (30.3% to 18.4%) shows a clear distance-decay pattern: the closer to the stadium, the more intense the impact.

The Distance-Decay Pattern

One of the most consistent findings across all three cities is what transportation planners call “distance decay”—traffic impacts diminish as you move farther from the venue:

  • New Orleans: 73.3% → 60.7% (12.6 percentage point decrease)
  • Santa Clara: 30.3% → 18.4% (11.9 percentage point decrease)
  • San Francisco: 13.1% → 12.5% (minimal decrease, suggesting distributed impact)

This pattern confirms what intuition suggests: the Super Bowl’s transportation impact is most intense at the venue itself and decreases with distance. However, even at 3 miles out, we still see double-digit percentage increases in most locations.


What This Means for Future Host Cities

For Transportation Planners

Cities bidding to host future Super Bowls should plan for:

  • 70%+ traffic increases in the immediate venue area (within 1.5 miles)
  • 50-60% increases in the broader venue zone (up to 3 miles)
  • Sustained impacts throughout Super Bowl week, not just on game day

For Businesses and Residents

If you live or work near a Super Bowl venue:

  • Expect significant increases in delivery times and congestion
  • Plan alternative routes, especially during peak hours
  • Consider the economic opportunity: increased traffic means increased customers

For City Officials

The data suggests several planning considerations:

  • Temporary traffic management measures should extend at least 3 miles from the venue
  • Commercial vehicle routing may need special attention, particularly for last-mile deliveries
  • Public transit alternatives become even more critical to manage the surge


Methodology Note

This analysis examined commercial vehicle telematics data during Super Bowl LX compared to baseline periods in January. We focused on circular zones with 1.5-mile and 3-mile radii around key venues:

  • The Superdome in New Orleans
  • Downtown San Francisco
  • Levi’s Stadium in Santa Clara

Traffic volumes were measured by unique vehicles and total trips during comparable time periods (6 AM to 9 PM) across weekdays, comparing the Super Bowl week period to typical January traffic patterns.


Conclusion

The Super Bowl’s impact on urban transportation is substantial and quantifiable. With traffic increases ranging from 12% to over 70% depending on proximity to venues, the event represents one of the most significant short-term disruptions to normal traffic patterns that a city can experience.

However, these numbers also tell a story of successful logistics. Despite these massive increases, cities manage to accommodate the surge, demonstrating the resilience and adaptability of urban transportation systems. For future host cities, the lesson is clear: plan early, plan comprehensively, and expect the impact to extend well beyond the stadium gates.

Recent news & releases