Real-World Data on Truck Stops Now Accessible to Infrastructure Operators and Planners
Altitude by Geotab and CATT Lab bring Stop Analytics into RITIS, giving DOTs and MPOs access to observed truck stop data from 6 million commercial vehicles.

The safe and efficient movement of people and goods is often considered the primary purpose of the transportation network. For commercial vehicles, which are largely responsible for moving goods around this network, roadway safety is important for both driver welfare and business operations. Safety lapses can cause injuries, collisions, delays, and other problems. Understanding safety in the transportation system can be challenging due to the variety of factors involved, including driver behavior, roadway infrastructure and the built environment, congestion and other vehicles, etc. We investigated this problem by using connected vehicle data from commercial vehicles to understand how transportation network safety varies from state to state for different vehicle classes.
For this analysis, we rely on insights that identify when unsafe activity occurs. We refer to these instances as harsh events. Harsh events occur when GPS-based acceleration exceeds a threshold value of ~3m/s2. These events are further categorized by directionality of the event, resulting in three distinct types: Harsh acceleration, harsh braking and harsh cornering. In this report, we focus on harsh acceleration and harsh braking events. To understand how the frequency of harsh events varied by state, we examined the number of harsh events per one million miles in each state. We used data collected from January 1, 2024 – November 30, 2024.
We compared the number of harsh events that occur per one million miles for two vehicle classes; medium-duty trucks (GVWR Class 3 – 6) and heavy-duty trucks (GVWR Class 7 – 8). The results are illustrated below in maps as well as in a state-level table. The maps show harsh events per million miles in hexagons that each cover approximately 4,700 square miles. The mapped bin sizes are loosely associated with percentiles ranges from the heavy-duty trucks results:
The western coast of California, some parts of central Texas and Florida, and a few other areas show the highest frequency of observed harsh events per million miles among medium-duty trucks. The mountain west region overall has the lowest frequency of harsh events with some exceptions around Boise, Idaho, Salt Lake City, Utah, and Denver, Colorado. Overall, our results show a higher frequency of harsh events per million miles for medium-duty trucks.
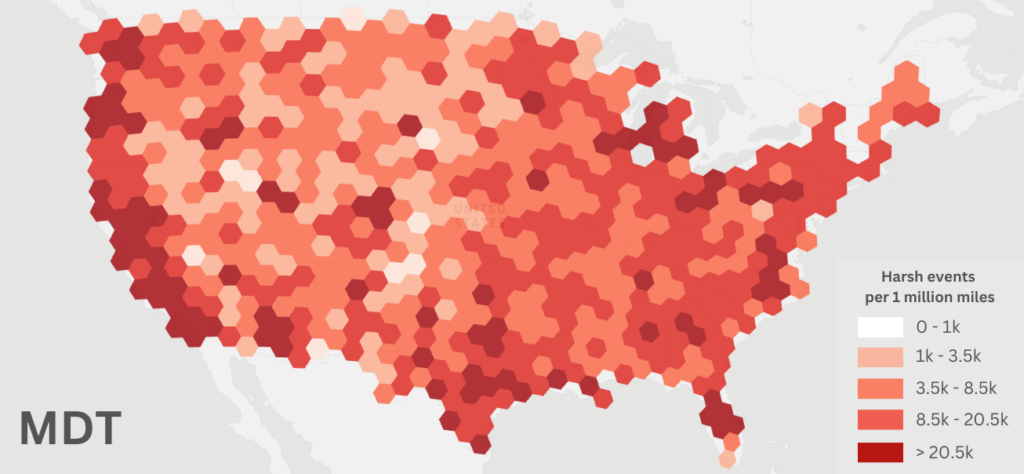
Harsh events per million miles driven for medium-duty trucks across the United States.
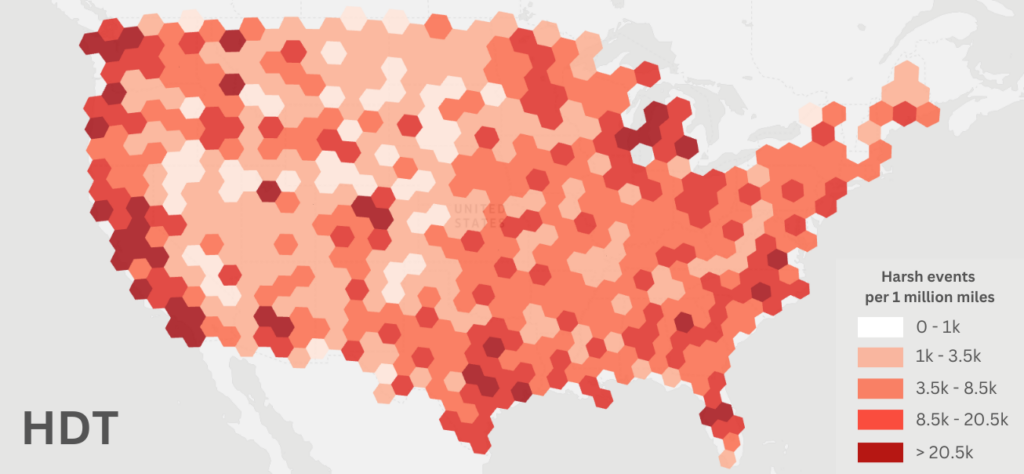
Harsh events per million miles driven for heavy-duty trucks across the United States.
In order to compare harsh event frequency between different roadways, we calculate the number of harsh events that take place for every 10,000 vehicle-trips. The map below shows the locations in each state with the highest number of harsh acceleration events per 10,000 traversals.
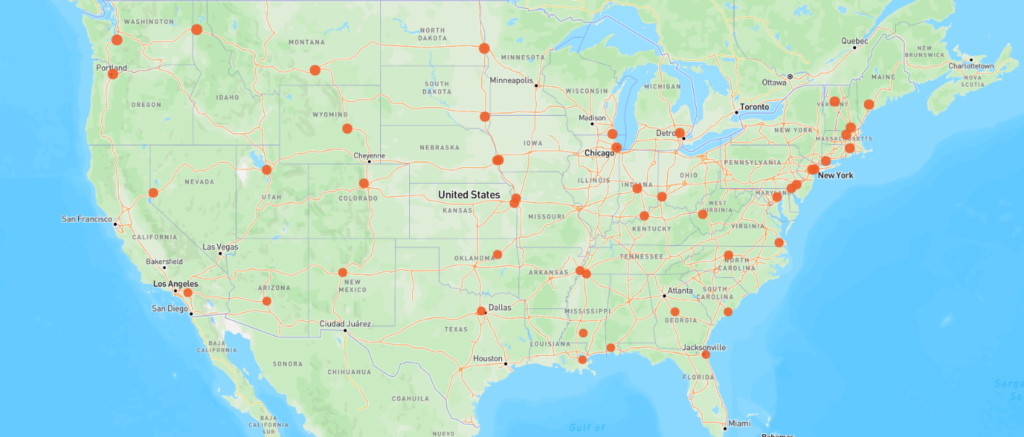
Harsh acceleration hot spots in each state. Hot spots indicate the locations with the highest observed number of harsh acceleration events per 10,000 traversals on the roadway.
Hot spots for harsh acceleration and braking events in 3 different states are shown below. We focus on Arizona, Colorado, and Florida to demonstrate the granular precision of the harsh event data.
Harsh events in Arizona are largely concentrated around the Phoenix metropolitan area extending westwards towards Tempe and Mesa
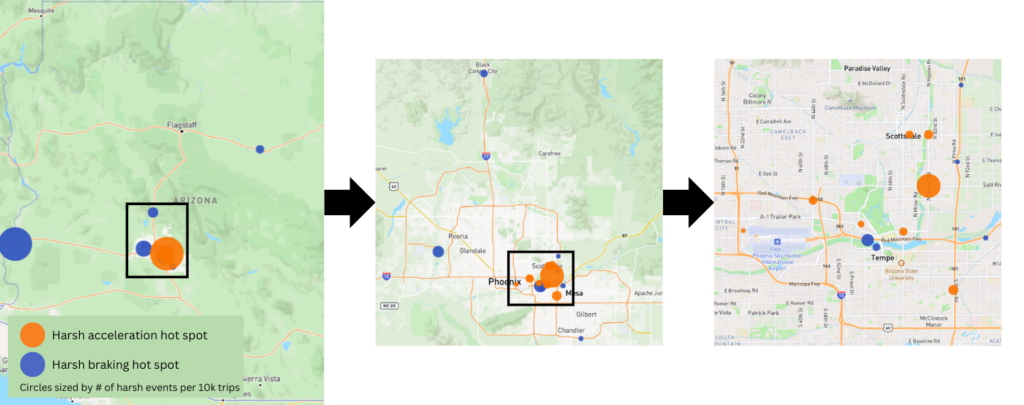
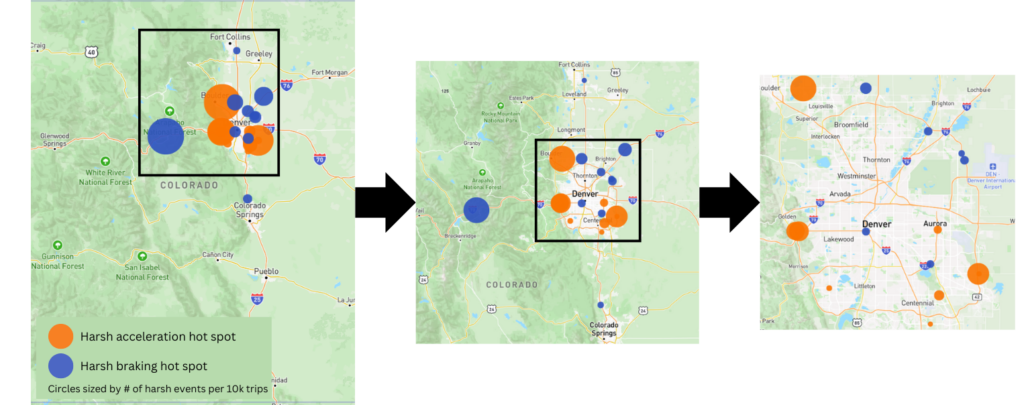
Harsh acceleration and harsh braking hot spots in each state. Hot spots indicate the locations with the highest observed number of harsh events per 10,000 traversals on the roadway. Maps zoom from left to right beginning with a statewide overview and ending with Phoenix/Tempe in which most harsh events are observed.
Harsh events in Colorado are concentrated around Denver, extending towards the suburbs in all directions. There are 2 notable hot spots outside of this area, one near Fort Collins and the other I-70 west of Denver. The I-70 hot spot shows an abundance of harsh braking events likely caused by the mountain pass in this area.
Harsh events in Florida are clustered near the state’s largest metropolitan area, including Jacksonville, Orlando, Tampa, and Miami.
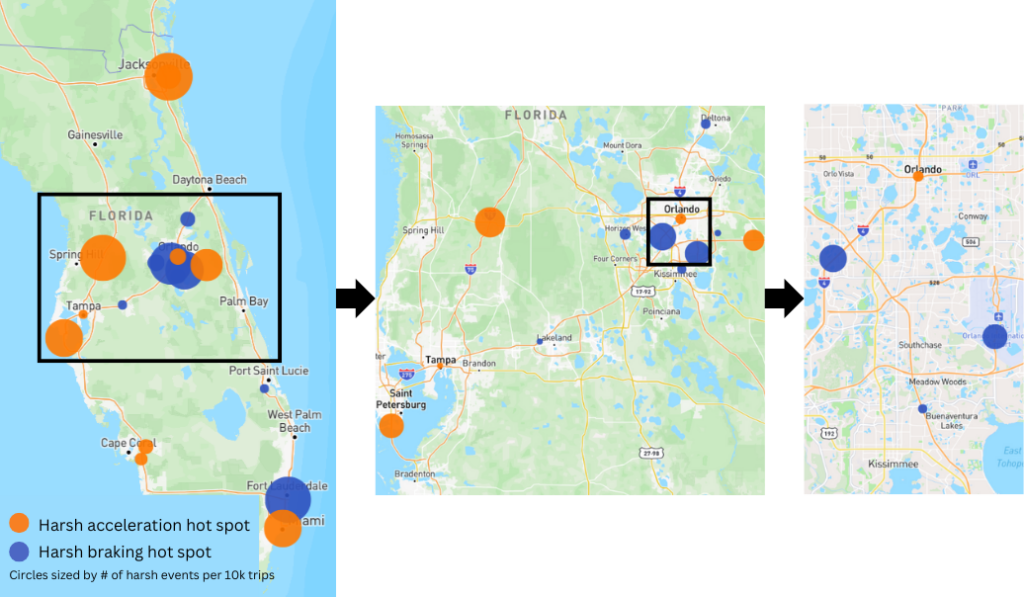
Harsh acceleration and harsh braking hot spots in each state. Hot spots indicate the locations with the highest observed number of harsh events per 10,000 traversals on the roadway. Maps zoom from left to right beginning with a statewide overview and ending with Orlando in which numerous harsh events are observed.
The occurrence of harsh events varies by time of day. We assess the number of harsh events per 10,000 traversals in 6 states to understand how time of day influences the possibility of harsh events. The results suggest that the likelihood of harsh events is higher overnight between the hours of 10pm and 3am and especially high between 1am and 3am.
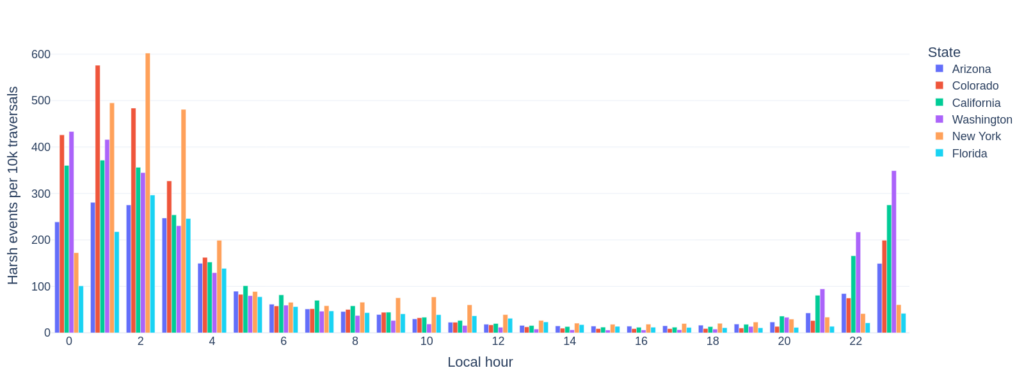
Harsh events per 10,000 traversals across time of day for 6 states.
Roadway safety is critical for all types of vehicles, including commercial. Understanding where unsafe events are likely to happen can help planners address infrastructure that may be associated with this behavior and help fleets educate their drivers about where and when to pay extra attention.
To learn more about Altitude’s harsh event insights, reach out to us here.
Altitude by Geotab and CATT Lab bring Stop Analytics into RITIS, giving DOTs and MPOs access to observed truck stop data from 6 million commercial vehicles.
Learn seven expert tips for fine-tuning origin-destination analysis parameters — from trip chaining to segment flow — to get accurate freight data faster.
Forecast truck parking demand before it becomes an enforcement problem. Altitude’s study reveals three data-driven factors shaping shortages in our busiest freight metros.