Commercial vehicle AADT: the most accurate estimates at national scale
This heavy-duty truck volume analysis shows how toll pricing differences reshape freight corridor behavior at the US-Canada border.


New York City’s new congestion pricing has accelerated traffic and reduced large truck presence in Lower Manhattan, yet idling remains largely unchanged, posing ongoing questions regarding the resulting impact on air quality.
New York City’s highly anticipated congestion pricing (CP) program, which was rolled out at the start of 2025, aimed to tackle the perennial issue of gridlock in Lower Manhattan. Early observations, including those recently highlighted by The New York Times, have already pointed to accelerated traffic flow and a reduction in passenger vehicle presence within the pricing zone.
While these initial reports offer valuable insights into the broader traffic landscape, they largely focus on private vehicles, leaving a significant piece of the urban mobility puzzle unaddressed: the critical role of fleet and freight vehicles. Now, with a few months under its belt, early data analysis conducted by Altitude by Geotab is beginning to paint a clear picture of the program’s initial impact on commercial vehicle movement. Leveraging the rich insights from Geotab telematics data, our findings align with some of these initial observations regarding overall traffic changes, but crucially, they dive deeper into how congestion pricing is specifically reshaping freight movement. We explored the program’s potential impact on the efficiency of the city’s supply chain, particularly for last-mile delivery.
Commercial vehicles are demonstrably moving faster through the designated congestion zone in Lower Manhattan. This suggests that the pricing mechanism is effectively reducing the sheer volume of traffic, allowing essentialdeliveries and services to proceed with greater efficiency. For businesses operating in and around the zone, this could translate to faster delivery times and improved productivity.
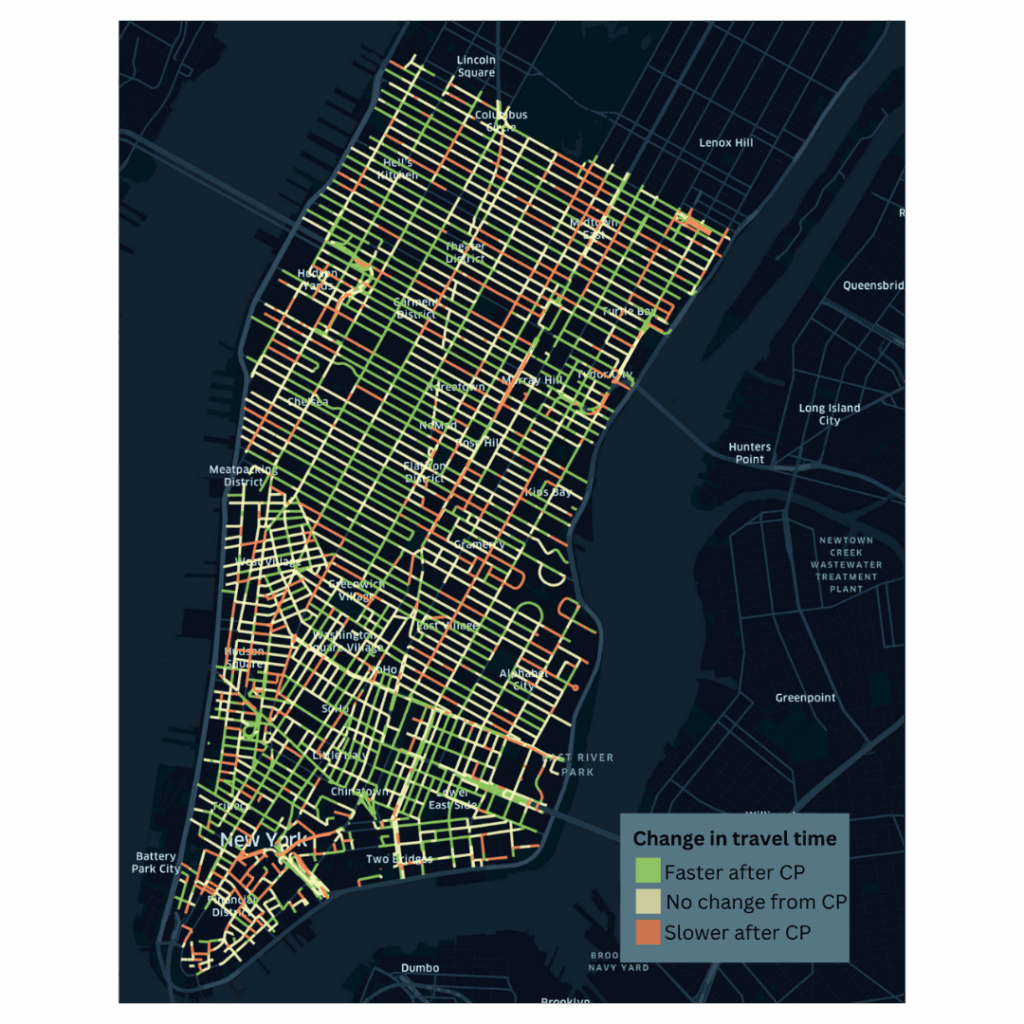
Our analysis shows that 44% of roadways in Lower Manhattan experienced faster travel times between 8 a.m. and 6 p.m. after the implementation of congestion pricing, 40% of roadways experienced no discernable change and 16% of roadways were slower on average after CP. The map shows how average travel time on each road was impacted by CP.
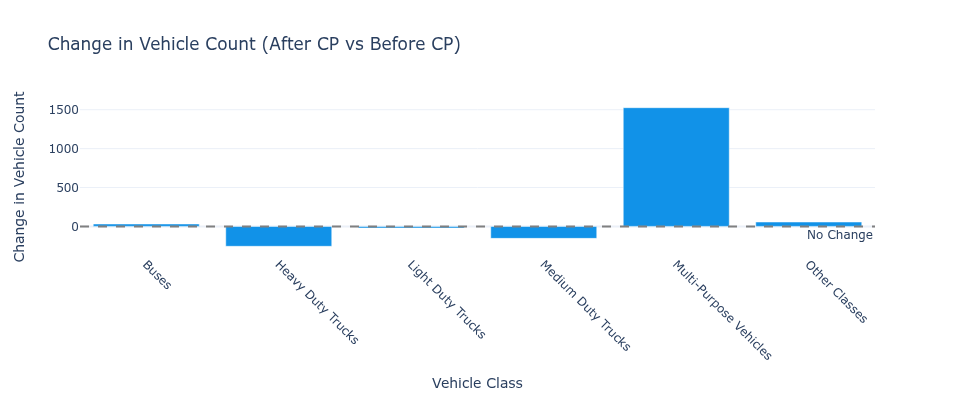
A deeper dive into the vehicle composition within the zone reveals interesting shifts. Our analysis indicates a noticeable decrease in the number of larger (medium- and heavy-duty) trucks entering the congestion pricing zone. This outcome aligns with the program’s tiered pricing structure, which imposes higher fees on larger, heavier vehicles. It appears that the increased cost is acting as a deterrent, possibly resulting in an increase of multi purpose vehicles in the congestion zone. This trend likely reflects a strategic adaptation by businesses. As larger trucks face steeper tolls, companies may be opting for smaller, more agile multi purpose vehicles for deliveries within Lower Manhattan, or even consolidating deliveries to maximize efficiency with these less expensive-to-toll options. This shift in fleet composition could have broader implications for urban logistics and last-mile delivery. The observed vehicle count changes are shown in the plot below. We compared vehicle counts from January through May 2024 to the same five-month period in 2025. Positive numbers indicate an increase in the number of vehicles after congestion pricing, while negative numbers indicate a decrease.
While the reduction in overall congestion and the shift in vehicle types are significant, is there a decrease in idling behavior? The Altitude data currently suggests a more nuanced picture when it comes to idling behavior. Despite the improved flow of traffic, our analysis has not yet shown a substantial change in how long vehicles spend idling within the zone. This is a crucial point, as reduced idling is directly correlated with improvements in air quality.
Furthermore, it’s important to consider other factors influencing idling behavior. For more insights, refer to our blog post: “The effects of temperature and land area on door-to-door delivery behavior in six North American cities.”
This leads us to the complex question of air quality impact. With fewer large trucks, which are typically major contributors to emissions, one might instinctively expect an improvement. However, the concurrent increase in multi purpose vehicles, coupled with the largely unchanged idling behavior, creates a more uncertain scenario. While smaller vehicles generally produce less emissions per vehicle than larger trucks, an increased volume of them (especially if they are still idling) could offset some of the potential environmental benefits. More time and further analysis will be needed to definitively assess the net effect of these opposing forces on air quality in Lower Manhattan.
What these initial insights from Altitude by Geotab underscore is the power of freight mobility data to deliver a deep understanding of evolving urban dynamics. The early success in improving commercial vehicle flow in Lower Manhattan is a testament to congestion pricing’s immediate impact on mobility. Furthermore, the observed shift in fleet composition (fewer heavy trucks, more multi purpose vehicles) highlights how businesses are strategically adapting their operations in response to new policy.
However, the consistent idling behavior, despite reduced congestion, presents a crucial area for ongoing analysis and potential improvement. This complex interplay between vehicle types, traffic flow and operational habits means that the long-term environmental outcomes, particularly for local air quality, remain a dynamic landscape best understood through continuous, granular data.
For fleet managers and urban planners alike, these findings emphasize the critical need for actionable intelligence. As New York City, and potentially other major urban centers, navigate these transformative policies, leveraging robust mobility data provides the clarity required to optimize routes, refine fleet strategies and contribute to more efficient, sustainable urban environments. With Altitude by Geotab data, understanding the full impact of these changes isn’t just possible: It’s foundational to informed decision-making.
Eager to delve deeper into how evolving urban dynamics, like those in NYC, could impact your operations or planning? Discover the unparalleled insights Altitude by Geotab can provide. Book a personalized demo with our experts today to explore how our data can help you quantify changes, optimize strategies and contribute to more efficient and sustainable urban environments.
Congestion pricing is a recent measure the City of New York implemented to help ease thick traffic within specific zones. Drivers must pay a fee in order to pass through these zones, with pricing fluctuating in correlation with peak demand windows.
Aggregated commercial traffic insights help transportation planners create new policies by helping them surface the most pressing inefficiencies in their networks. DOTs are then able to brainstorm new traffic-calming strategies aimed at solving these issues and test how effective the solutions are through a careful process of implementation and results measurement. As your agency develops new policies, use commercial vehicle insights to gauge if they’re working over time.
New York City is a current customer that relies on our aggregated data to accomplish a number of different transportation projects, including traffic-calming strategies, road safety initiatives and regional freight planning.
This heavy-duty truck volume analysis shows how toll pricing differences reshape freight corridor behavior at the US-Canada border.
This heavy-duty truck volume analysis shows how toll pricing differences reshape freight corridor behavior at the US-Canada border.
Altitude by Geotab and CATT Lab bring Stop Analytics into RITIS, giving DOTs and MPOs access to observed truck stop data from 6 million commercial vehicles.