Never be restricted to pre-defined geographic boundaries or zones for your parking analysis again with the new Stop Cluster feature in the Altitude platform. Users no longer need to restrict their search for parking hotspots or stopping points using the map’s predefined shapes and sizes of geography zones. The Stop Analytics module allows you to identify stops by road segment, zone, hex cell, and now by clustering with the Stop Cluster feature.
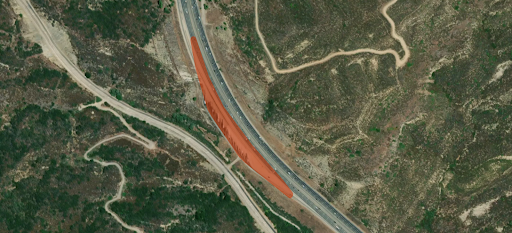
Remove the limits of your parking analysis to quickly generate polygon bounds of stopping areas that even include varying stop densities or shape distributions like stops along a stretch of highway or in a parking lot that wraps around a building.

The Stop Cluster analysis can show where commercial vehicles are stopping along highway networks and group the entire parking area as one stop cluster
Why do clusters matter?
Transportation planning authorities require commercial vehicle parking insights to make informed parking management decisions. With the Stop Cluster feature, users get the most accurate customer reporting and benchmarking of where commercial vehicles stop and park. This information aids in several real-world planning scenarios, including:
- Creating safer parking environments for heavy-duty trucks- Assess the needs for heavy-duty vehicle parking without pre-defining how the geography to be analyzed is divided. Instead, if stretches of highway or areas in a city are often used for parking, they will be readily apparent and can be sliced and diced for your unique analysis. Coupling this with land use information or satellite imagery can also help uncover the context behind these parking events, informing parking infrastructure decisions to create safer truck stops along highway networks.
- Preparing for the future of electric vehicle charging- The Stop Cluster feature helps users assess where electrification infrastructure should be built based on high-volume parking groupings. Seeing where and for how long commercial vehicles tend to park will help planners identify the suitable types of charging infrastructure to implement. Again, by looking at land use and satellite imagery, planners can determine if future electrification needs will best be met by public or private charging infrastructure.

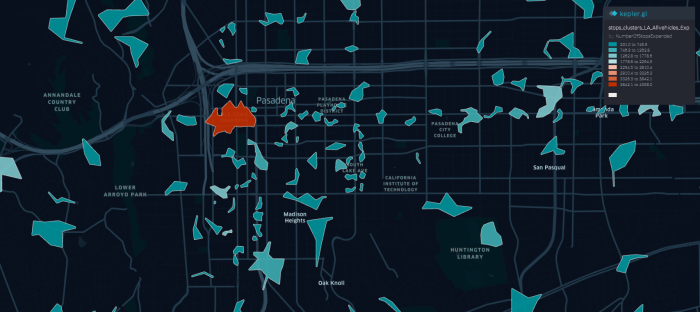
Looking at the stop cluster patterns and stop durations of commercial vehicles in Pasadena can help pinpoint where electric vehicle charging infrastructure should be prioritized
The new Stop Cluster feature means greater granularity in your analysis and captures vehicle stops that may have been missed.
For more information about the Stop Analytics module available in the Altitude platform, visit our webpage. Or, if you’re new to Altitude by Geotab, contact one of our Altitude specialists to schedule a demo.


