5 ways freight corridor AADT data fills federal count gaps
5 ways freight corridor AADT data in 90 days supports federal counts—get timely, class-specific truck volumes for better planning.


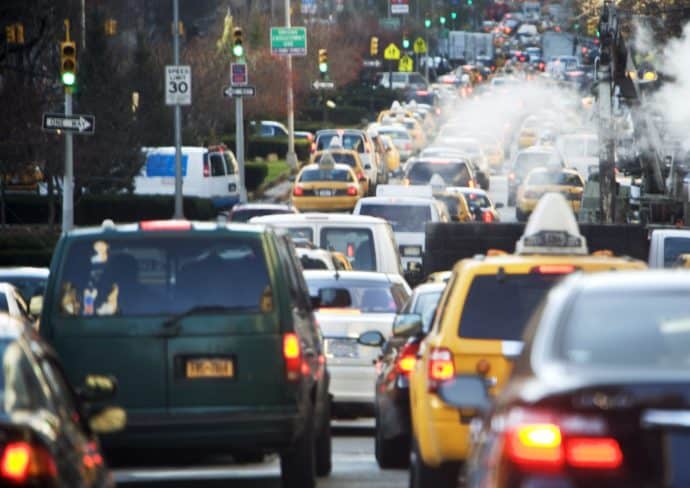
The Gardiner Expressway, one of Toronto’s primary throughways, has been under construction since late March 2024. We used aggregated commercial vehicle telematics data from Altitude by Geotab to understand how this construction has impacted travel times in Canada’s largest city, which also happens to be the third largest city in North America. While most major metropolitan areas in North America have their share of congestion, especially during commuting hours, the extensive renovation project on the Gardiner has caused major increases in the time it takes to travel through Toronto.
The Gardiner Expressway strategic rehabilitation plan includes six different areas of construction, one of which has already been completed and two of which are currently underway. Significant renovations began in late March 2024 and Altitude by Geotab published an assessment of the impact of that construction last year. In April, a new round of construction began, further impacting traffic on the Gardiner. We studied how travel times have evolved over the past year and will explain how much extra time commuters can expect to spend in traffic.
The map below shows the section of the Gardiner Expressway that we considered in our analysis.
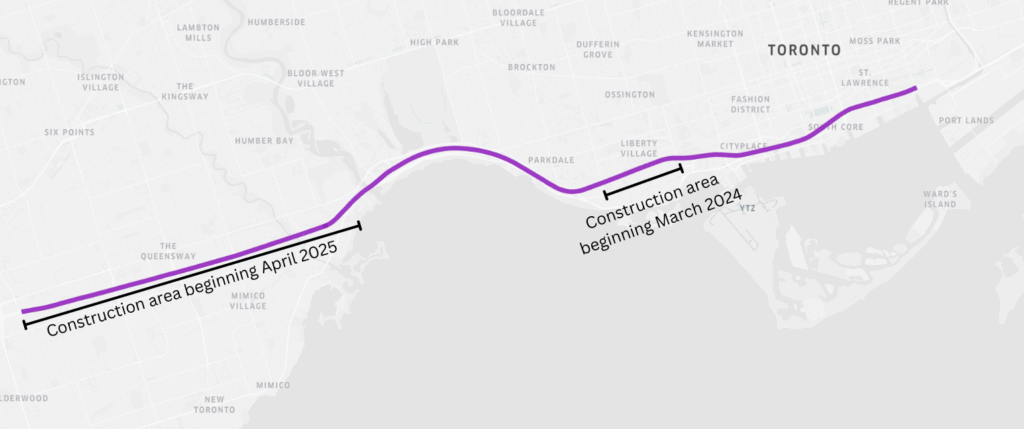
While some drivers may be able to get by without having to drive the entire length of the Gardiner shown in the map above, our analysis was focused on how long it takes to go from one end to the other. We considered vehicles traveling eastbound during the peak morning hour (7:30 a.m. – 8:30 a.m.) and westbound in the afternoon (4:30 p.m. – 5:30 p.m.). We also looked at eastbound and westbound travel times during the middle of the day (11:30 a.m. – 12:30 p.m.). The tables below show average observed travel times on the Gardiner during various time periods:
| Dates |
Morning peak, eastbound: Average observed travel time |
Afternoon peak, westbound: Average observed travel time |
| Jan. 8 – Mar. 22, 2024
(before construction) |
23 minutes |
25 minutes |
| Mar. 25 – Apr. 12, 2024
(first three weeks of construction in 2024) |
39 minutes |
39 minutes |
| Apr. 15 – Dec. 20, 2024 and Jan. 6 – Apr. 12, 2025
(ongoing construction in 2024 and 2025) |
33 minutes |
35 minutes |
| Apr. 13 – May 2, 2025
(first three weeks of construction in 2025) |
40 minutes |
38 minutes |
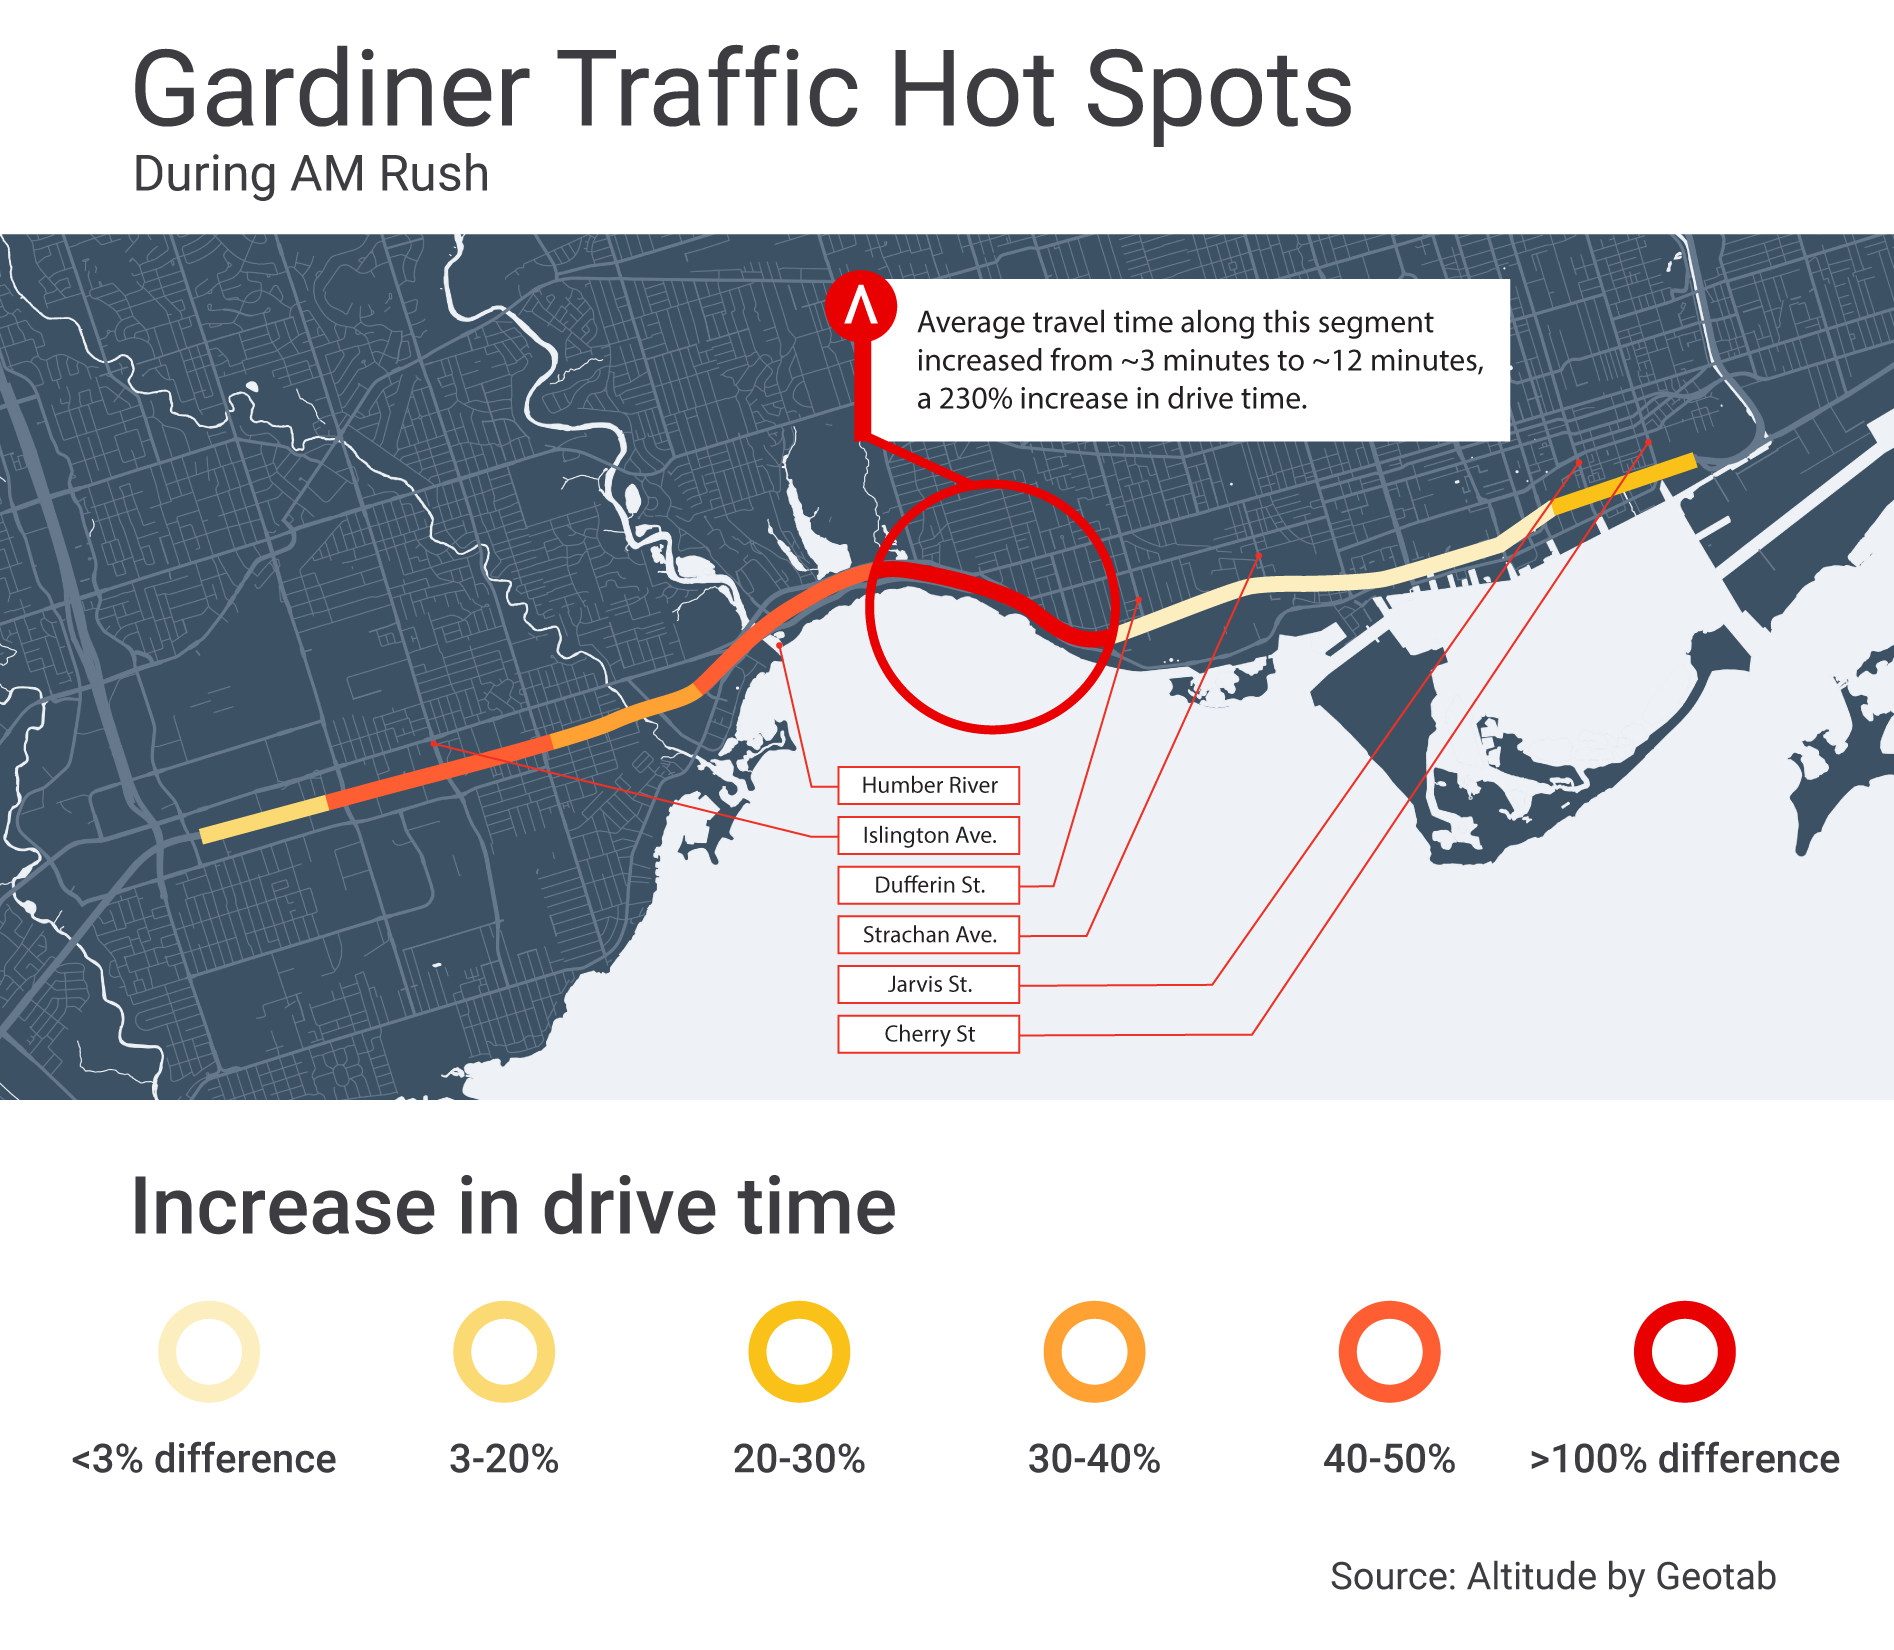
The map above shows increased eastbound travel times on the Gardiner Expressway towards downtown Toronto during the 7:30-8:30 a.m. rush hour, comparing early 2024 (pre-construction) with conditions after new construction began in 2025. Delays were found to be at their worst along the segment of the Gardiner that spans from Colborne Lodge Drive to just past Jameson Avenue.
Fortunately, if the pattern from 2024’s construction activity holds, there may be some small reprieve (in the realm of five minutes or so) coming for Toronto drivers, as the first few weeks of construction give way to the new normal.
A deeper dive into the best and the worst along the Gardiner
Last year, we found that during peak commuting hours some areas of the Gardiner were experiencing increased travel times of around 250% compared to before construction started. This year, we found that the most congested sections of the Gardiner experience a delay of about 230% while traversing the whole segment of the Gardiner between Highway 427 and Cherry St generally takes 2x as long as before construction (corresponding to a 200% change). A more detailed comparison to last year’s findings is shown below:
| Section of the Gardiner |
Travel time before construction |
Travel time at the beginning of construction in 2024 |
Travel time at the beginning of new construction in 2025 |
| Humber River to Strachan Ave |
8 minutes |
20 minutes |
24 minutes |
| Jarvis St to Dufferin St |
11 minutes |
25 minutes |
30 minutes |
The impact of the 2024 Gardiner construction continues to affect surrounding streets, with travel times remaining high. Lake Shore Boulevard, for instance, which parallels the Gardiner, has shown a persistent 30% average increase in travel time over the last 14 months.
While some commuters and commercial vehicles with flexible schedules may be able to travel on the Gardiner during the middle of the day, instead of during peak hours, travel times have also increased mid-day. The table below shows that a mid-day, westbound trip that used to take 11 minutes now averages about 21 minutes (91% increase) due to construction.
| Dates |
Mid-day, eastbound: Average observed travel time |
Mid-day, westbound: Average observed travel time |
| Jan. 8 – Mar. 22, 2024
(before construction) |
11 minutes |
11 minutes |
| Mar. 25 – Apr. 12, 2024
(first 3 weeks of construction in 2024) |
16 minutes |
25 minutes |
| Apr. 15 – Dec. 20, 2024 and Jan. 6 – Apr. 12 , 2025
(ongoing construction in 2024 and 2025) |
18 minutes |
21 minutes |
| Apr. 13 – May 2, 2025
(first 3 weeks of construction 2025) |
21 minutes |
21 minutes |
No matter how we slice and dice the data, the conclusion remains clear that construction on the Gardiner has had a significant, negative impact on commuters and commercial vehicles who can now expect to spend an average of 2x as much time on the Gardiner compared to pre-construction travel times.
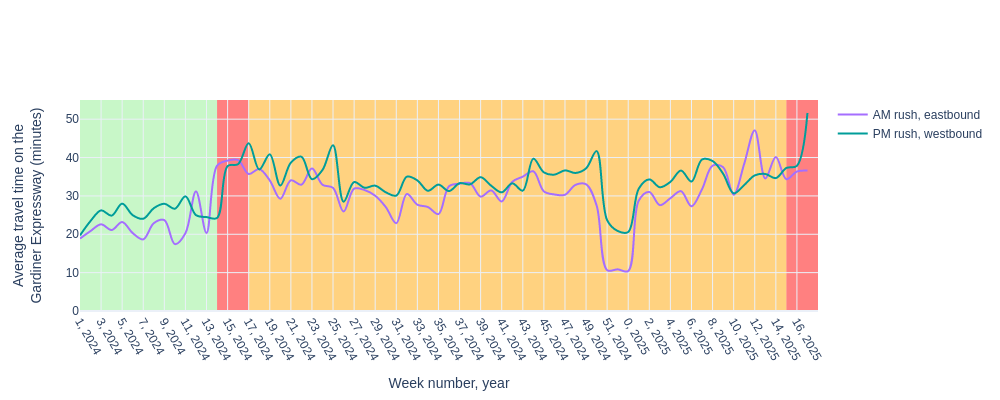
The plot above shows average observed travel times during peak commuting hours every week since the beginning of 2024. While the data shows that weekly fluctuations are the norm, the construction activity that began in March 2024 significantly increased normal travel times.
Traffic patterns and overall travel times continue to be impacted as a result of the Gardiner Expressway’s construction processes. With the roadwork expected to continue throughout the next year, drivers should plan for significant delays along their commutes, especially when large sporting events, concerts or other community events come to town.
To similarly study construction’s effects on your region’s traffic movement and create smarter congestion solutions, choose Altitude. Our turnkey mobility analytics platform enables you to surface real-world commercial vehicle trends, measure changes in traffic flows and deduce where improvement is most needed. Study roadwork’s impacts on driver behaviors and where the most common bottlenecks are happening with Altitude to promote safer, smoother traffic flows along your network.
Learn more about how Altitude can help you solve unique traffic challenges and improve road safety for all by reaching out to us.
5 ways freight corridor AADT data in 90 days supports federal counts—get timely, class-specific truck volumes for better planning.
After 12 months of NYC congestion pricing, Altitude by Geotab data shows commercial fleets increased trip efficiency by 15%, adapting their operations and vehicle types.
One year of NYC congestion pricing data reveals fewer commercial vehicles making 15% more trips despite tolls, with traffic speeding up on 37% of roads.