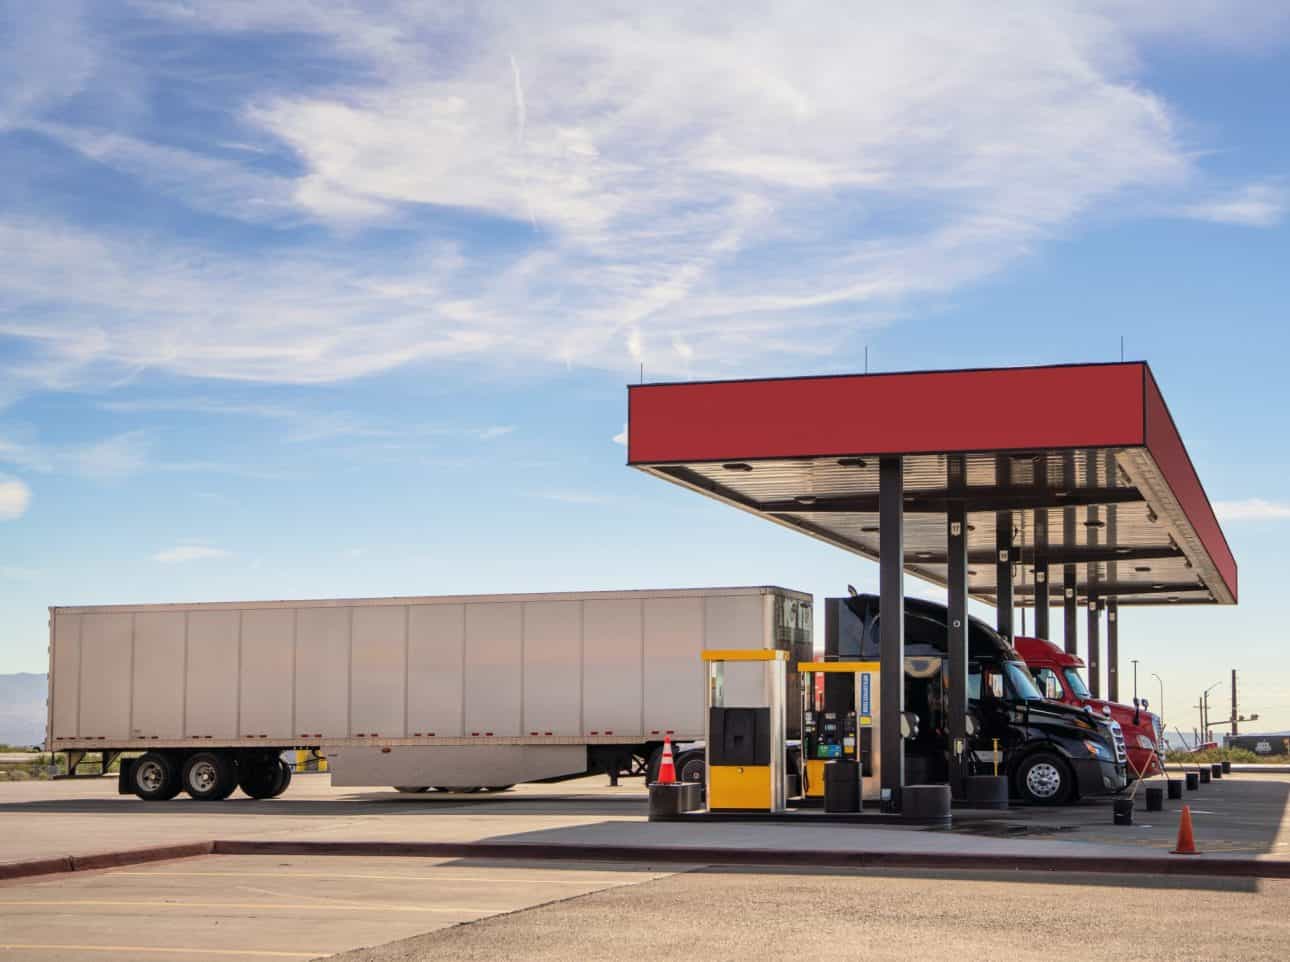
Every new fuel site is a multi-million dollar gamble. Land acquisition, permits and construction can tie up capital for a decade or more. The wrong choice can leave operators locked into an underperforming corridor. On the surface, a busy interchange may look promising, but the real test is whether the right customers are driving past. Without visibility into commercial demand, the first decision becomes a high-stakes guess.
If you are solely relying on traditional site-selection tools, such as Average Annual Daily Traffic (AADT), you are not getting a complete answer because they treat every vehicle the same. A compact sedan adds one to the total in the same way as a commercial box truck, even though the latter has a much higher potential value for fuel retailers. This lack of differentiation conceals the corridors that truly generate revenue.
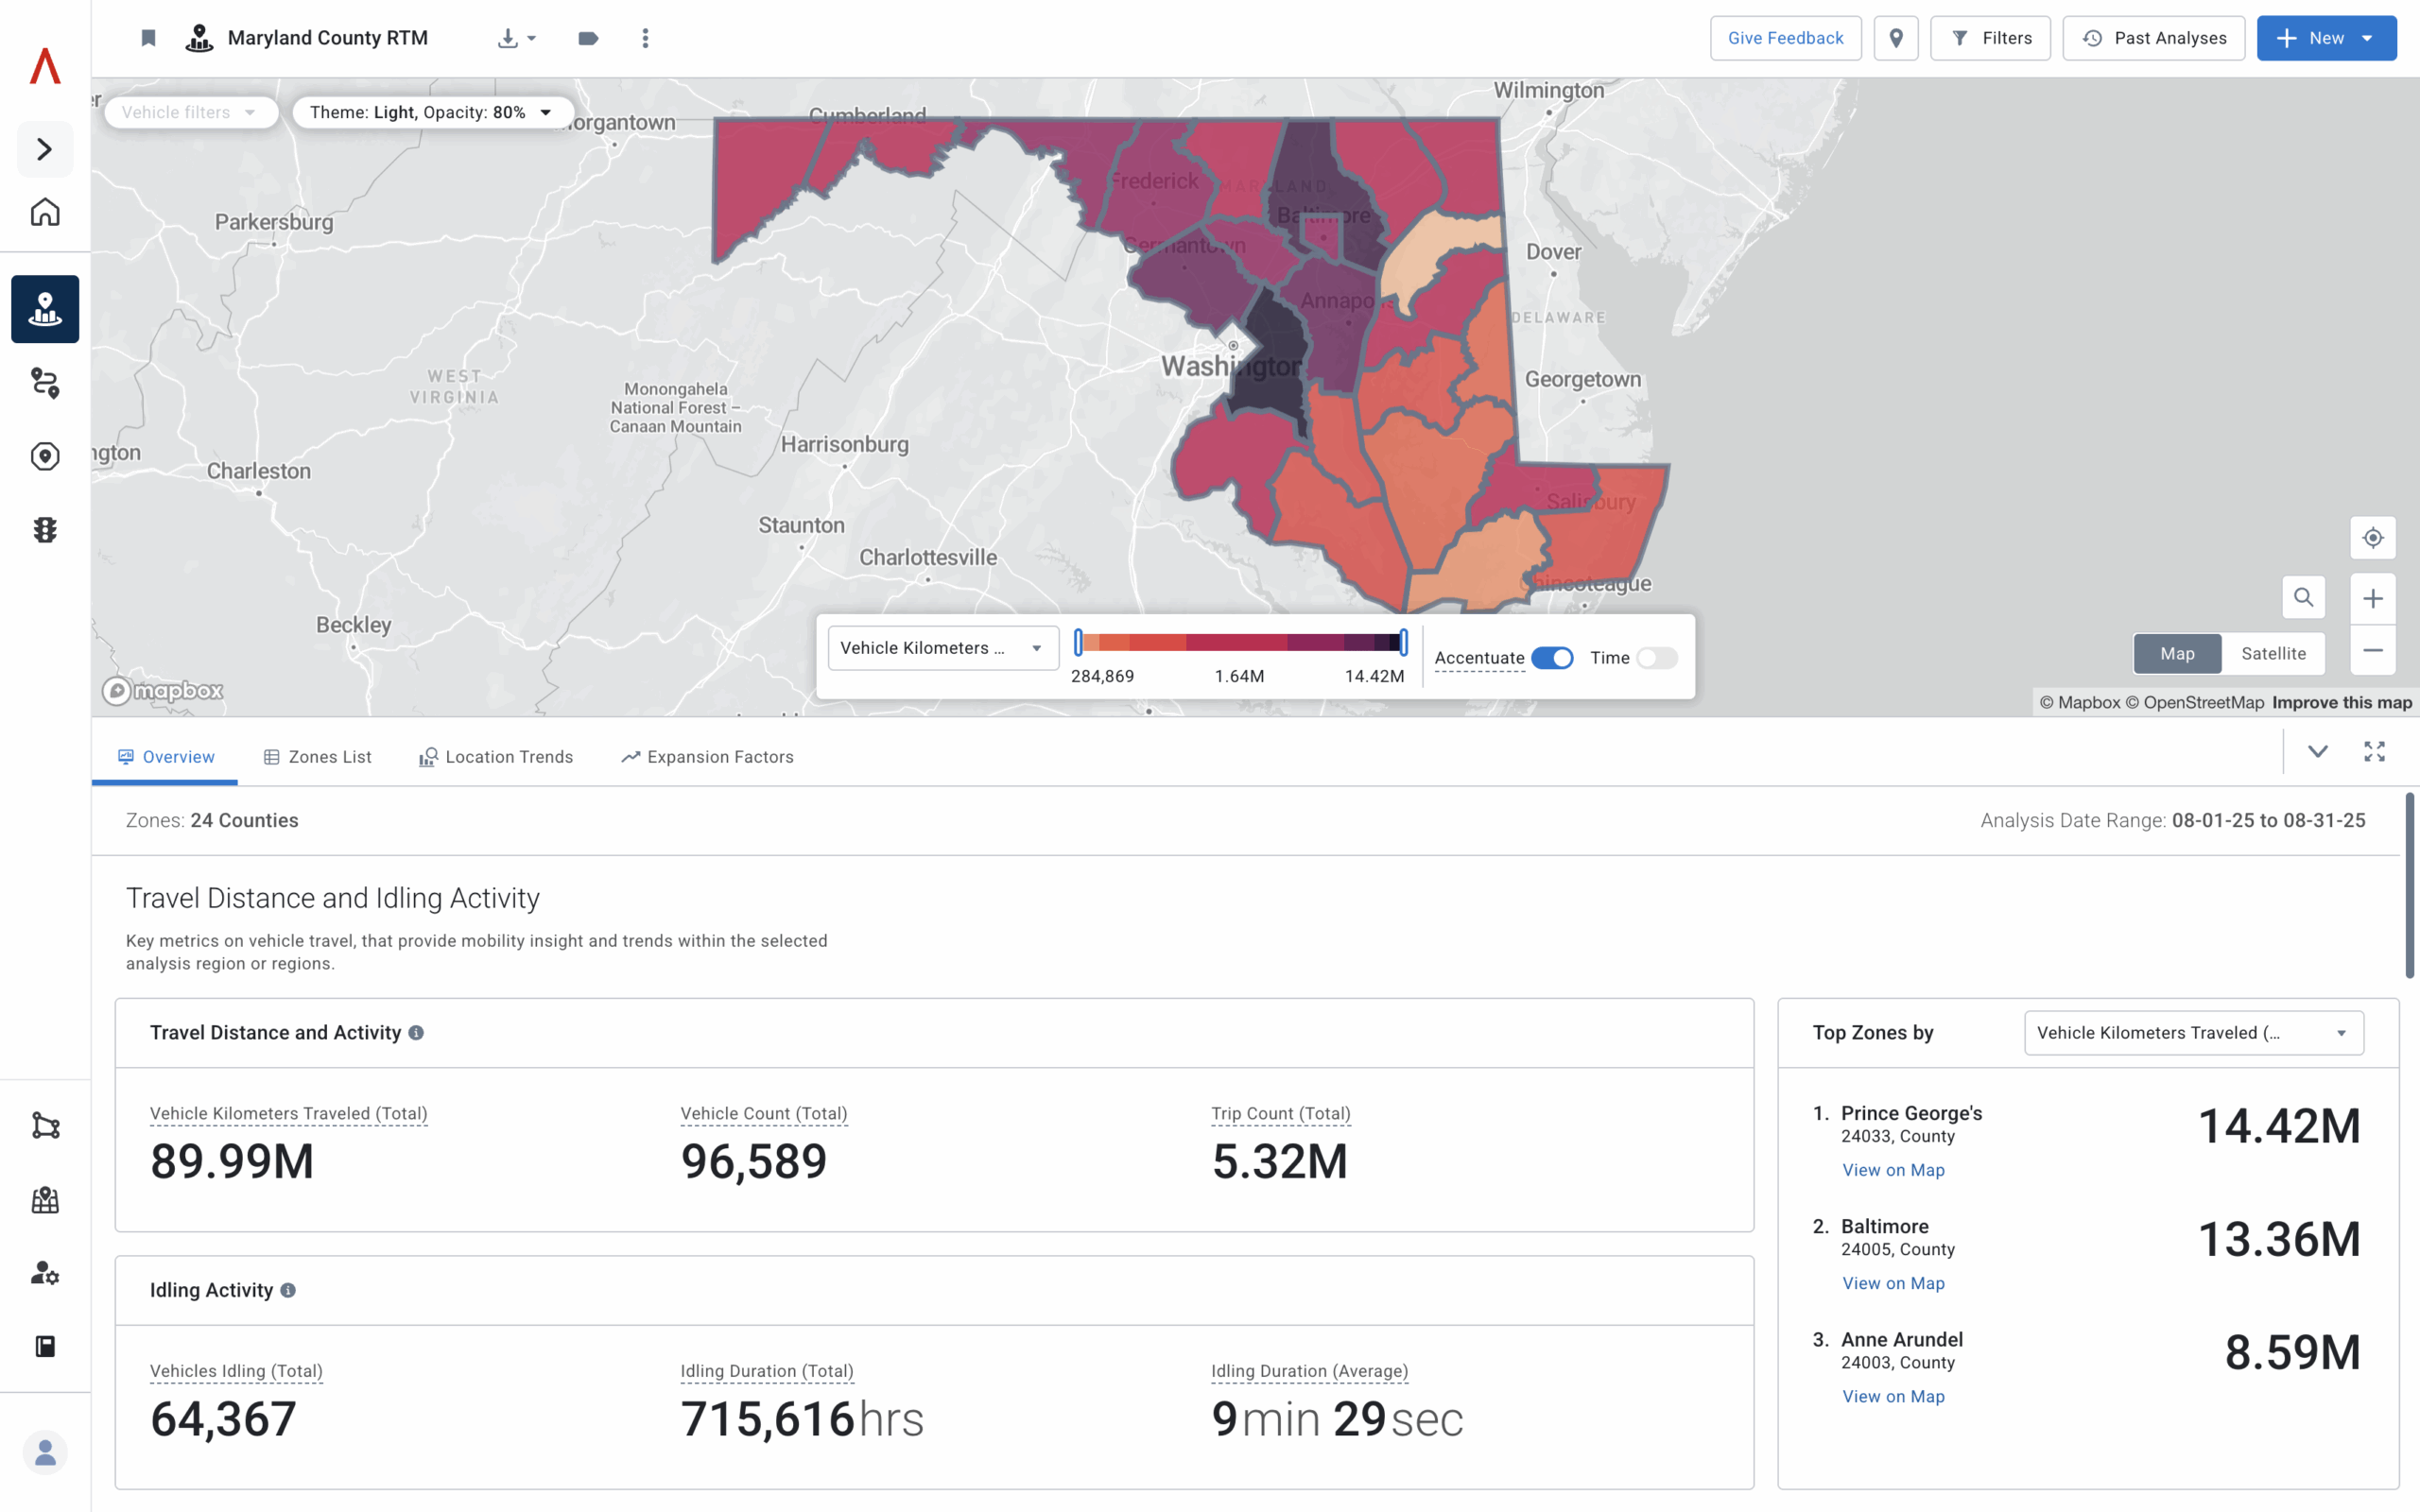
Regional Travel Metrics (RTM) inside Altitude by Geotab changes the first decision from a gamble to a defensible strategy. These commercial movement insights capture vehicle journeys, enriched with class, fuel type, vocation and stop behavior to show real-world patterns.
The information is aggregated and anonymized to protect privacy while offering a continuous view of corridor activity throughout the year. This transforms corridor selection into a choice based on measurable value rather than surface impressions.
Catch what AADT overlooks for a more complete view
AADT remains a useful baseline for overall traffic, but it only provides part of the picture. It does not show which vehicles drive fuel demand. Commuters may dominate a suburban highway with high counts, while a freight corridor with fewer vehicles can generate more gallons if a large share are long haul trucks.
Permanent counters add more detail but have limitations of their own. They are costly to install, unevenly distributed, and rely on annual averages that can smooth over important variation. A construction project or detour can alter patterns for weeks and distort the yearly result.
Commercial movement insights extend what AADT and counters provide. They separate passenger from commercial traffic, reveal where vehicles stop and track corridor activity continuously. By measuring stop counts, dwell times, queue patterns, pump utilization, bypass rates and turning-path compliance, they turn corridor evaluation into a reflection of real demand rather than a proxy based only on traffic volume.
Commercial movement insights help reveal true fuel demand
Commercial movement insights deliver a deeper perspective on corridor activity by focusing on the vehicles that drive gallons sold. Instead of only measuring how many vehicles pass through, they capture operational behaviors such as where fleets stop, how long they dwell and how they interact with nearby facilities.
These details move corridor evaluation from traffic volume toward an understanding of real commercial demand.
Altitude by Geotab delivers these insights by analyzing aggregated and anonymized signals from millions of vehicles across North America. The dataset is refreshed daily, offering planners and businesses a continuous, year-round perspective of commercial movement. Each journey is further enriched with details such as:
- Vehicle class: light-duty, medium-duty and heavy-duty
- Fuel type: gasoline, diesel and alternative fuels
- Vocation: long haul, hub and spoke, local delivery and other movement patterns
- Journey details: distance traveled, start and end times, and mid-trip stops
This level of detail helps decision-makers move beyond surface numbers and focus on the patterns that reveal real commercial demand. It shows where freight corridors concentrate activity, how rest requirements shape demand, and which regions see the most influence from energy-intensive fleets.
With this knowledge, planners can select corridors more effectively, align investments with actual demand and design infrastructure that reflects real-world operations.
Focus on the customers that drive demand
Commercial vehicles drive a significant share of U.S. fuel consumption. Research shows that Class 3-8 vehicles consume over 20% of all U.S. fuel. In fact, Class 8 trucks alone account for two-thirds of freight fuel.
By contrast, a passenger vehicle typically uses about 13 gallons every two weeks. A medium-duty van consumes 40–70 gallons several times per week, while a heavy-duty truck can exceed 100 gallons in a single stop. The effect compounds when frequency is considered.
Long haul trucks average more than 60,000 miles per year, creating a steady refueling cycle. Local delivery fleets cover 13,000–20,000 miles annually, translating into repeat visits. Corridors with a higher share of commercial vehicle activity consistently deliver greater fuel volumes than commuter corridors with equal or even higher total traffic.
Commercial movement insights also reveal patterns shaped by regulation. Hours of Service (HOS) rules require drivers to rest after set driving intervals, creating predictable refueling and rest stops along major corridors. When those clusters overlap with logistics hubs, demand becomes steady and repeatable. Understanding how these clusters shift by time of day or day of week creates a valuable advantage in choosing corridors and planning future investments.
A three-step playbook to de-risk new builds
Selecting the right corridor is never simple, but working through a structured process can make the decision more defensible. Imagine applying the following five steps when evaluating a market such as Illinois.
1) Spot where demand is rising
Start wide. Look across a state or region to see where commercial vehicle activity (counts, trips, VMT) is growing fastest compared with last year or two years ago. This quickly separates “busy” corridors from places where fuel-relevant demand is actually accelerating.
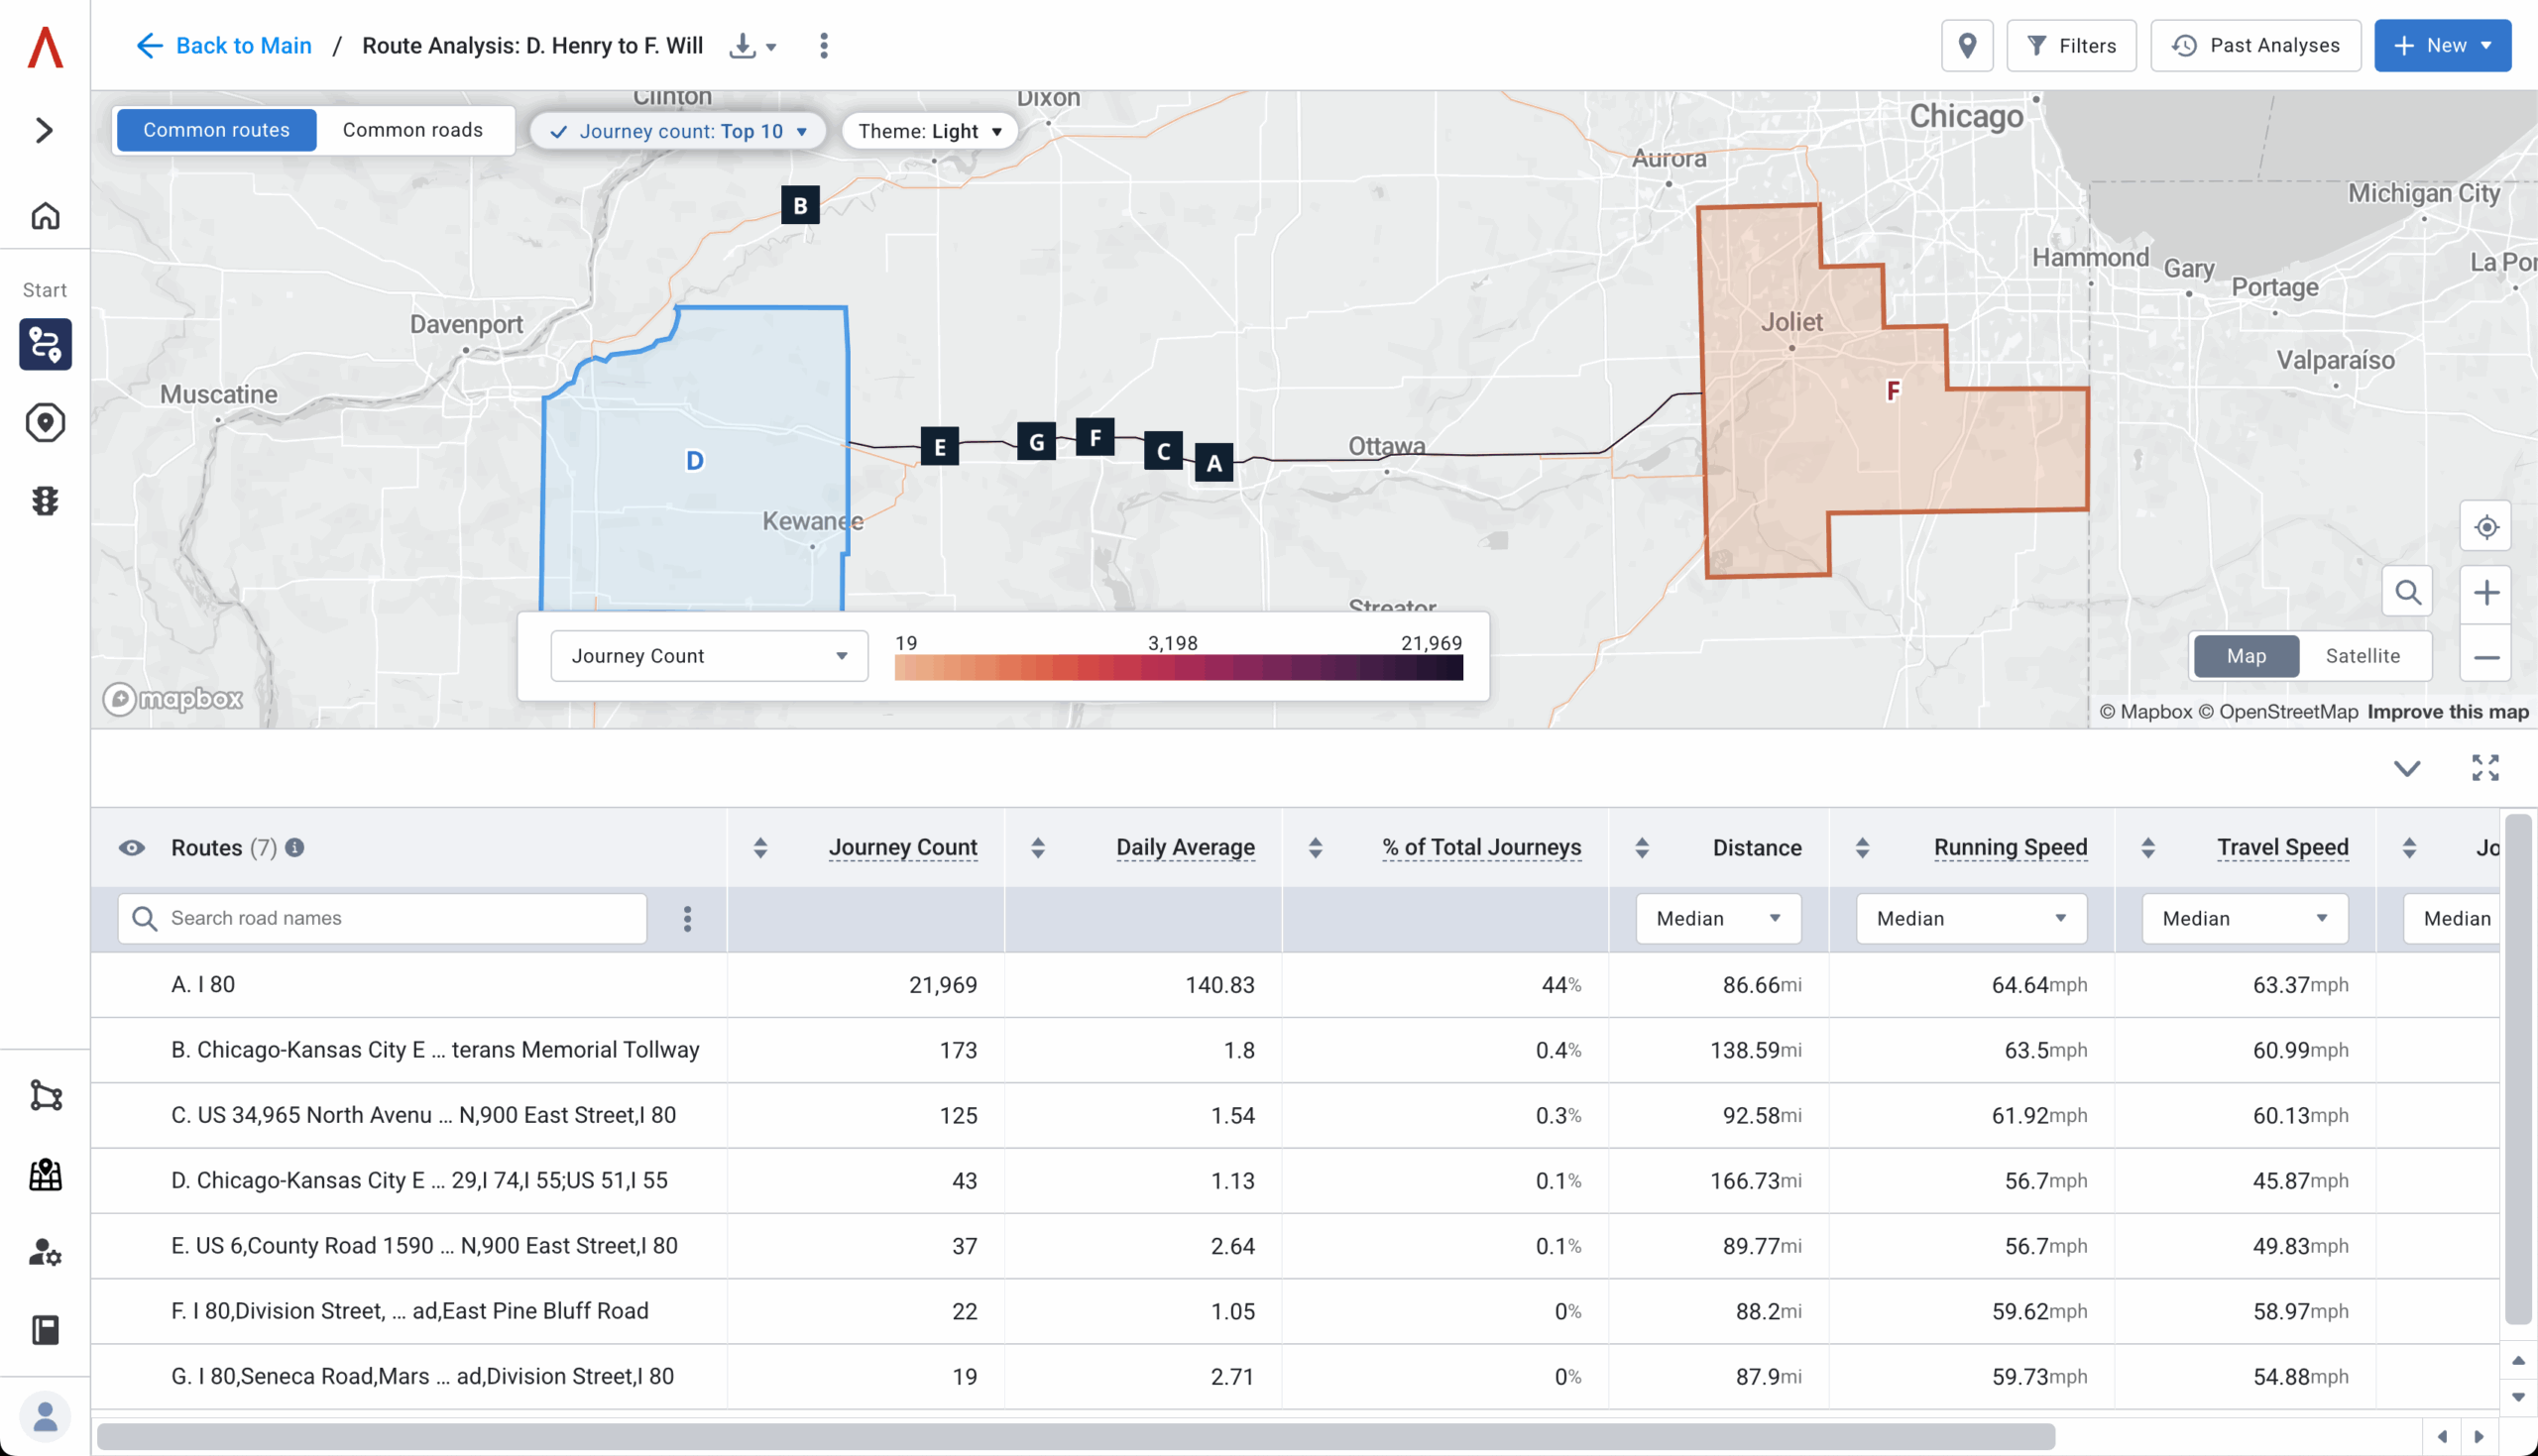
2) Follow how your customers move
Zoom into those fast-growing areas to understand which roads your ideal customers use. For example, Class 8 along interstates for diesel programs, or light/medium commercial along arterials for gasoline. Get route-level counts so you can see which specific segments are gaining the most momentum.
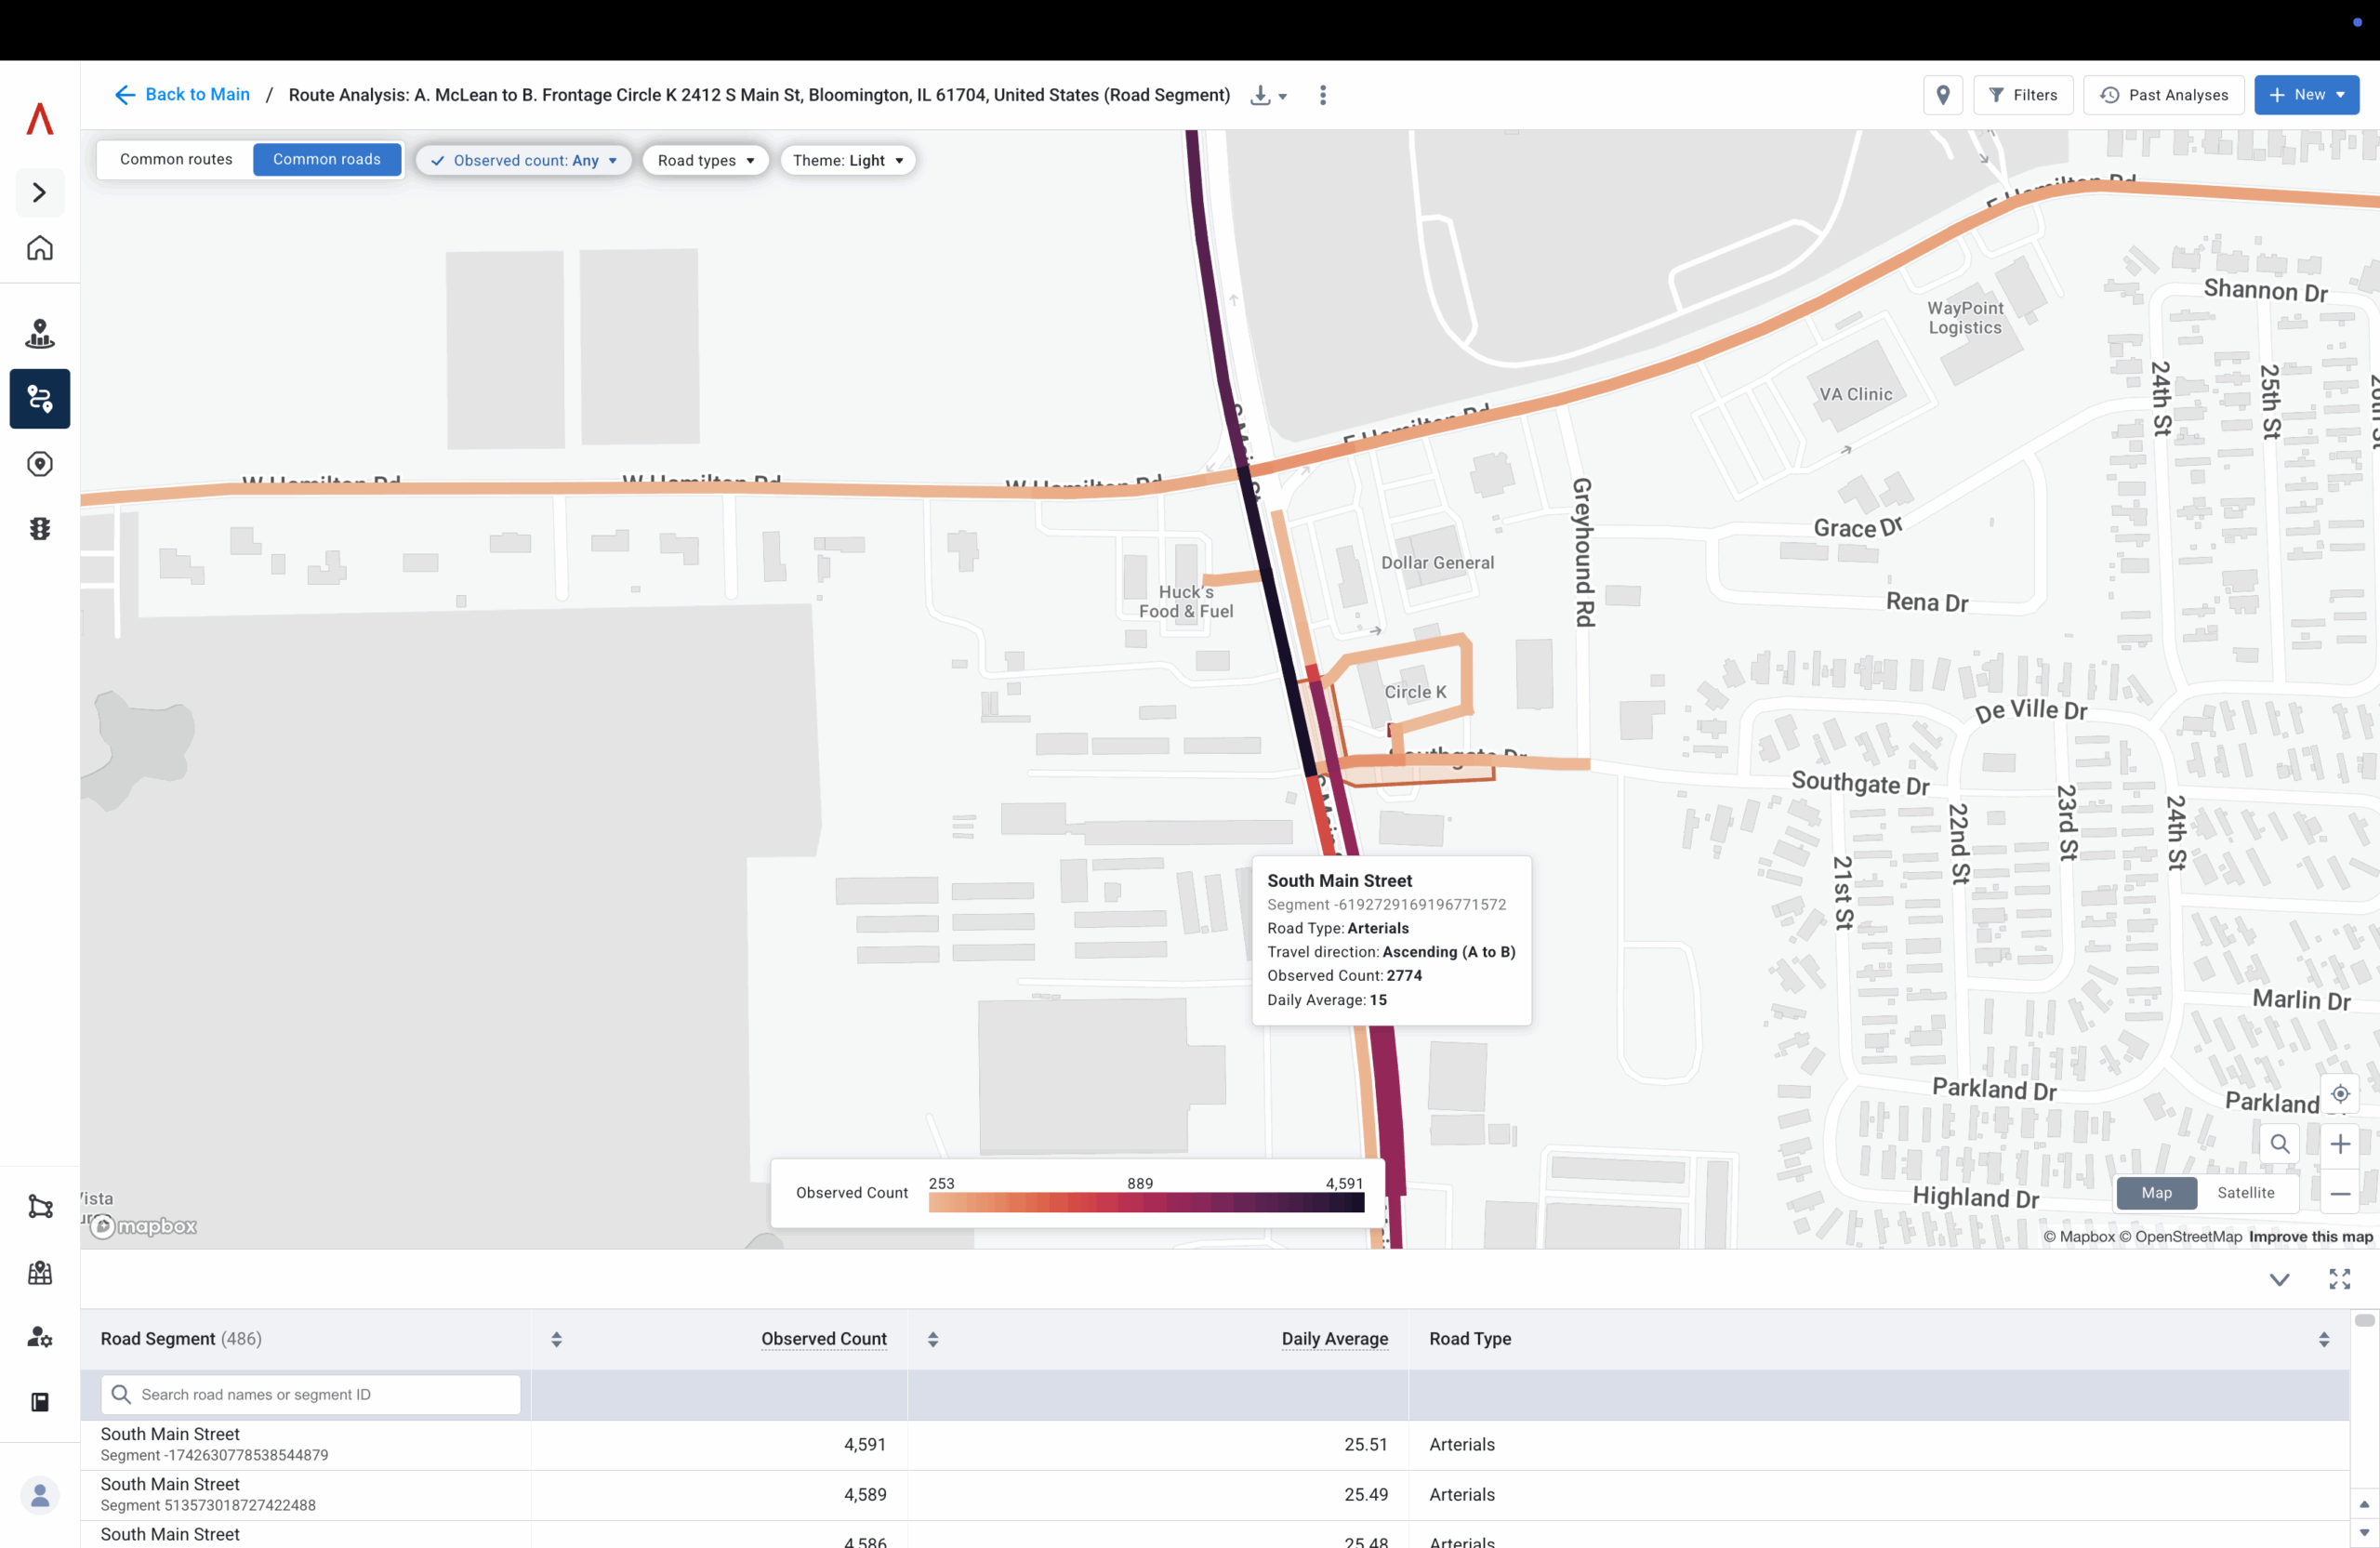
3) Compare nearby sites to plan where you’ll win
On the fastest-growing routes, look at nearby fuel sites—both yours and your competitors. Compare simple signals like capture rate (how much passing traffic stops) and canopy stop rate (how often stop-ins convert to fueling). Use this to decide where a new build, expansion, or acquisition is most likely to add incremental gallons.
Proven results from real-world sites
Findings from the Altitude by Geotab fuel retailer report show how commercial movement insights can challenge assumptions and uncover opportunities.
Rural sites can outperform urban corridors
In Tennessee, a retailer discovered that a rural interchange with only half the AADT of a nearby city bypass outperformed the urban site by 30% in gasoline gallons. The difference came from a 48% commercial share. Although the commuter traffic volume was lower, the rural location attracted the right mix of vehicles that refuel frequently and in larger volumes. This example illustrates why evaluating commercial share provides a clearer picture of demand than relying only on raw traffic counts.
Parking can unlock new demand
In Ohio, an operator improved performance at an underutilized site by adding 30 van-sized parking bays. Within six months, gasoline pull-through increased by 15%. The additional capacity allowed local delivery fleets to access the site more easily and refuel without congestion. This showed how adjustments to site design, guided by insights into vehicle mix and dwell behavior, can translate directly into stronger sales performance.
Commercial share builds greenfield confidence
Another operator used RTM to evaluate a potential site near a new Interstate connector. Although the corridor showed modest AADT, the 53% commercial share projected a three-year payback once the interchange opened. By quantifying the role of commercial traffic, the analysis supported a land-banking decision that might otherwise have been considered too risky. Commercial movement insights provided the evidence needed to justify a greenfield investment.
Building confidence in site decisions
These cases highlight different ways that data-driven insights can inform strategy, whether through choosing stronger locations, adapting site design, or planning for long-term growth. Each example shows how focusing on the commercial vehicle segment opens new opportunities that are often hidden in traditional traffic counts.
What this means for capital planning
For capital planners, the value of commercial movement insights rests on three clear advantages. The first is precision, because decisions focus on the customers who consume the most fuel rather than on the busiest corridors. This ensures that new investments are aligned with the fleets that generate steady revenue, not with traffic that looks impressive but delivers little volume.
The second is speed, because a statewide scan can be completed in minutes. Instead of waiting months for traditional studies, teams can quickly compare multiple regions and respond to opportunities while they are still viable. This accelerates the planning cycle and keeps projects moving forward.
The third is confidence, because expansion factors and detailed journey data convert early signals into forecasts that executives and risk officers can stand behind. When projections are grounded in observed patterns, they become easier to validate and more likely to secure approval.
Taken together, these advantages streamline the approval process and release more capital for growth. Rather than tying up funds in sites that require costly remediation, planners can allocate resources toward projects with a stronger foundation and a clearer path to performance.
Fueling smarter growth
Commercial movement insights give fuel retailers more than a way to avoid underperforming sites. They provide a foundation for growth by revealing where real demand exists and how it changes over time. Instead of treating all traffic as equal, these insights highlight the specific corridors where commercial vehicles purchase fuel most frequently and in the highest volumes.
In practice, this means understanding movement patterns at scale: how vehicles travel across regions, where they tend to stop, and the conditions that drive repeat refueling. These patterns point to the corridors, interchanges, and hubs most likely to deliver sustained demand.
For capital planners and real estate teams, this translates into a disciplined approach to site selection. Growth decisions can be based on measurable demand rather than assumptions, approvals move faster, and capital can be allocated with greater confidence. Over time, this consistency turns the first decision on each new build from a gamble into a strategy for sustainable expansion.
For more information about de-risking new builds with commercial movement insights, check out the Altitude by Geotab fuel retailer report, or join us for our NACS webinar “Fueling Smarter Growth: Applying Commercial Vehicle Movement Insights to Fuel Retail & Truck Stop ROI” on Tuesday, October 28, at 02:00 PM ET.