Understanding how, where, and why commercial vehicles move offers powerful clues about upcoming changes in business, including infrastructure, logistics, and commerce. By analyzing aggregated, anonymized commercial vehicle movements, we can identify emerging trends that often precede major business and economic shifts.
Here, we explore three types of commercial transportation analyses that act as leading indicators for what’s next in the movement of goods, services, and people.
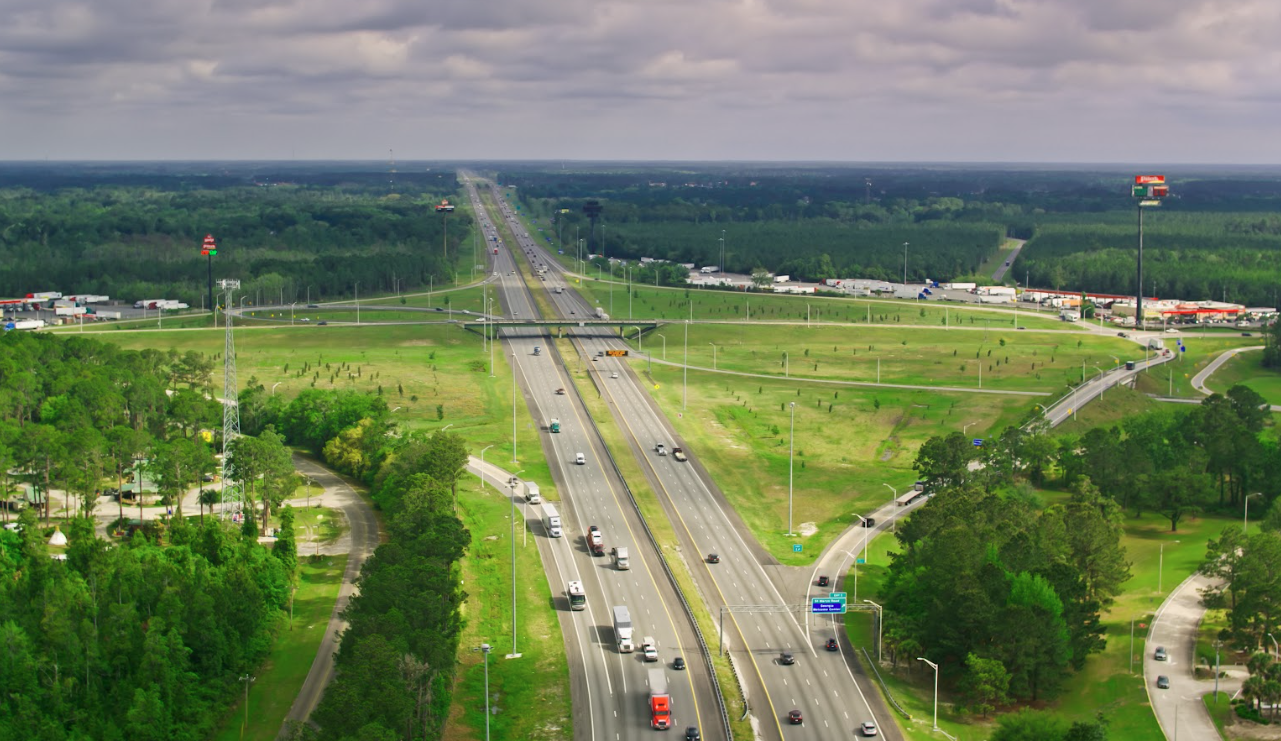
Corridor analysis: Freight flow as an economic signal
Is freight traffic volume rising, falling, or holding steady? Shifts in freight movement often reveal economic patterns before other indicators do. Corridor analyses examine volume changes across specific routes to understand where freight is increasing or decreasing, and why.
For example, corridor-level shifts often track with policy and macroeconomic changes in adjacent markets. For example, when commercial traffic dips after tariffs (as analyzed in this study) or surges during economic recovery, the ripple effects extend to infrastructure, maintenance schedules, and even local commerce.
Takeaways and leading indicators include:
- Rising corridor volume may signal a need for infrastructure reinvestment — such as more frequent maintenance, capacity expansion, or dedicated freight lanes.
- Falling freight activity can hint at shifting supply chains or reduced industrial output.
- Freight volume changes may also intersect with tourism and retail activity, offering clues about local economic resilience or transition.
Vocation and composition: What vehicle types reveal
A corridor analysis becomes even more valuable when paired with vocation analysis. Understanding which types of commercial vehicles are operating in a region can surface key insights about evolving industries.
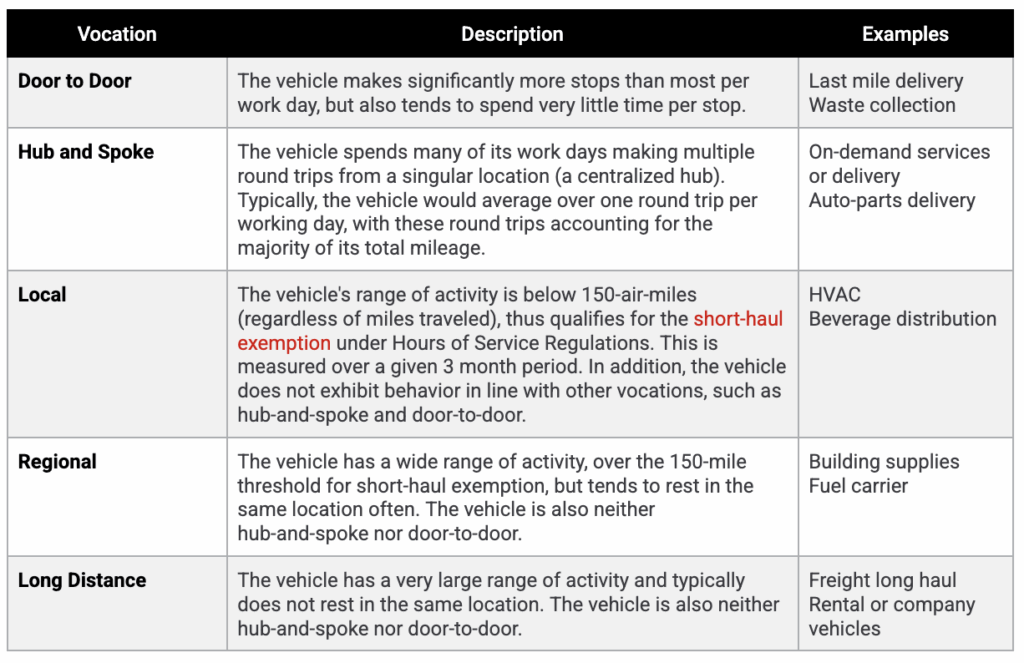
Categories of commercial vehicle vocations that can be analyzed using Altitude by Geotab.
For example, in an analysis of New York City’s truck routes, Altitude’s corridor and vocation segmentation helped pinpoint where high-volume commercial traffic occurred off designated truck routes. The resulting “freight efficiency score” framework helped local agencies identify where to prioritize infrastructure updates and improve freight performance.
Pinpointing a rise in light- and medium-duty vehicle activity (such as multi-purpose vans or pickups) may indicate an expansion in last-mile delivery or local commerce. Conversely, increases in heavy-duty freight may suggest stronger industrial or long-haul logistics activity.
An Altitude by Geotab analysis of multi-purpose vehicle activity shows how these shifts emerge in up-to-date trends. In the study, vocation and composition data were used to track the rise of multi-purpose vehicles (MPVs) in last-mile delivery, helping planners identify where to prioritize improvements like better on- and off-ramps, truck parking, or turning lanes.
Commerce implications include:
- Growth in delivery-class vehicles signals rising demand for curbside access and loading infrastructure — critical for urban business vitality.
- Persistent congestion or unauthorized roadside stops can indicate pressure points where businesses are constrained by limited logistics space.
- Understanding the mix of vehicle vocations enables more targeted infrastructure planning, balancing freight needs with urban mobility and safety.
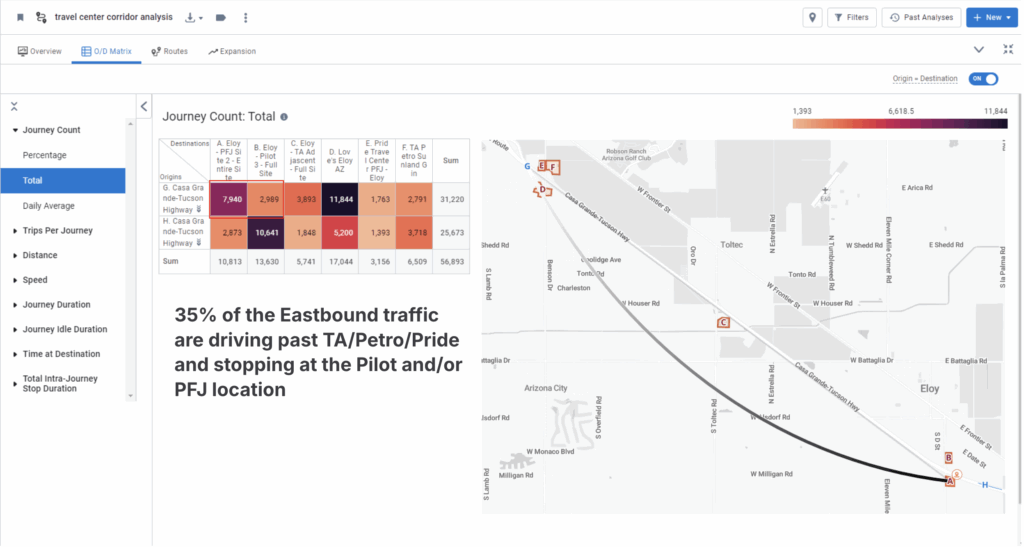
Stop data: Where and how vehicles pause
Where commercial vehicles stop, and for how long, can point to important economic shifts. Stop analytics illuminate trends in delivery behavior, vehicle utilization, and even the readiness of existing infrastructure for new technologies like EV charging.
Using our Stop Analytics module, one project evaluated trucks stopped at existing fuel sites, their duration of stay, and travel ranges. This data helped assess whether those locations were well-suited to host electric charging infrastructure, identifying both high-potential and underutilized sites.
Another analysis used stop clustering to uncover where trucks frequently pulled over outside approved rest areas or points of interest. This data is a clear indicator of insufficient parking availability or route inefficiencies.
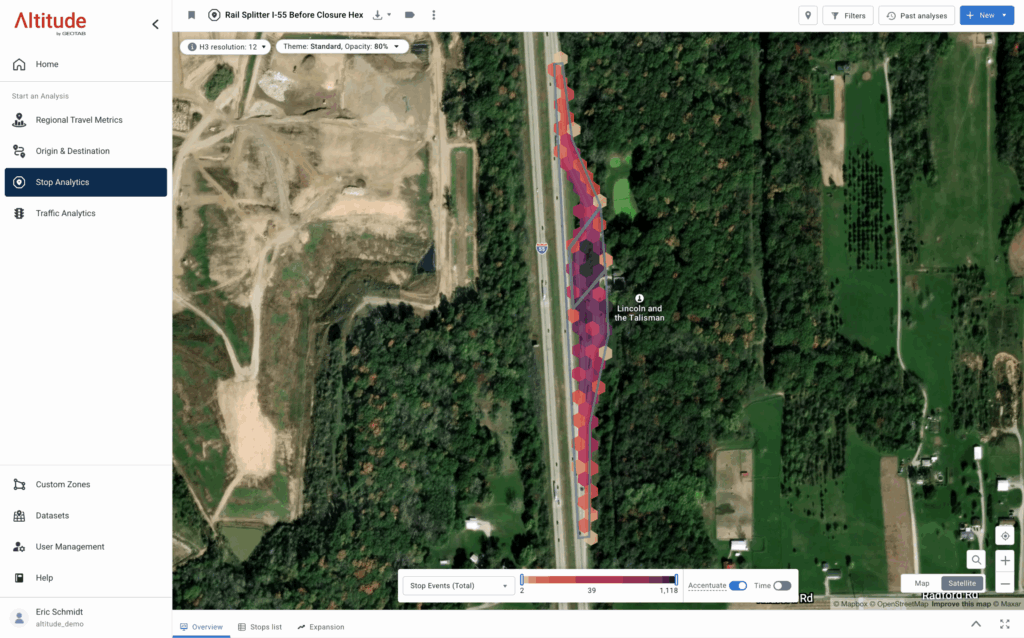
Analysis of freight stop-clustering uncovers “hot spots” for unauthorized truck stops, highlighting need for nearby parking.
Key takeaways include:
- Rising stop activity often signals new commercial development or growth in delivery activity.
- Longer average stop times for commercial traffic may indicate business expansion, longer on-site work, or extended visits.
- Commercial vehicle stop patterns can point to emerging travel corridors and hospitality opportunities.
Reading the trends for resource prioritization
From freight corridors to curbside stops, commercial movement insights offer an up-to-date view of how economies move, and can serve as an early indicator for areas that deserve further study. By interpreting these patterns and trends, public agencies and businesses can detect early signs of rising or falling commerce, or shifts to different kinds of economic activity.
Developers and agencies can then prioritize infrastructure investments according to where freight traffic is increasing or decreasing. They can plan urban space and curb access based on delivery vehicle trends. Or identify regions ready for EV charging infrastructure.
Commercial vehicle analytics are more than traffic metrics. They can serve as early warnings and opportunity maps for the next wave of economic and infrastructural change.
Our SupplyChainTalk webinar shares how to identify hidden opportunities, mitigate risks, and optimize your investments for maximum ROI.