Commercial vehicle AADT: the most accurate estimates at national scale
This heavy-duty truck volume analysis shows how toll pricing differences reshape freight corridor behavior at the US-Canada border.


We explored how data from commercial vehicles can be used to understand the impact of hurricanes on specific geographies. We defined three key metrics that can be used to measure the severity of extreme weather and applied these metrics in North Carolina and Florida.
The southeastern United States has been slammed by back to back hurricanes in recent weeks, leading to severe flooding, widespread power outages and all-around disruptions to normal life. For fleets, severe weather events can pose a logistical challenge, as it is difficult to plan around unknown obstructions to business as usual. While the Waffle House Index helps folks determine the intensity of impending storms, Geotab’s Altitude data helps fleets understand if they can fully resume normal operations. Insights from Altitude, which harnesses the anonymized data from hundreds of thousands of connected commercial vehicles, can be used to understand storm severity and gauge the longevity of disruptions.
We used three different metrics to understand the impact of Hurricane Helene and its resulting flooding in North Carolina (with an emphasis on the area around Asheville) and Hurricane Milton in Florida (with an emphasis on the area around Tampa). These metrics are:
Vehicles equipped with Geotab GO devices have their driving activities recorded and then sent electronically to a server. The amount of time it takes for data to be sent from a GO device and then recorded on a server can be considered a proxy for cell connectivity. In other words, when this time is very short, the GO device is likely in a location with good cellular coverage. Conversely, when this time is slow, it may be indicative of poor cell service. Even under normal circumstances, some geographies have bad cell service (this is often true in very rural locations). However, when power is out, locations that typically have good or moderate cell service may suddenly experience much worse connectivity.
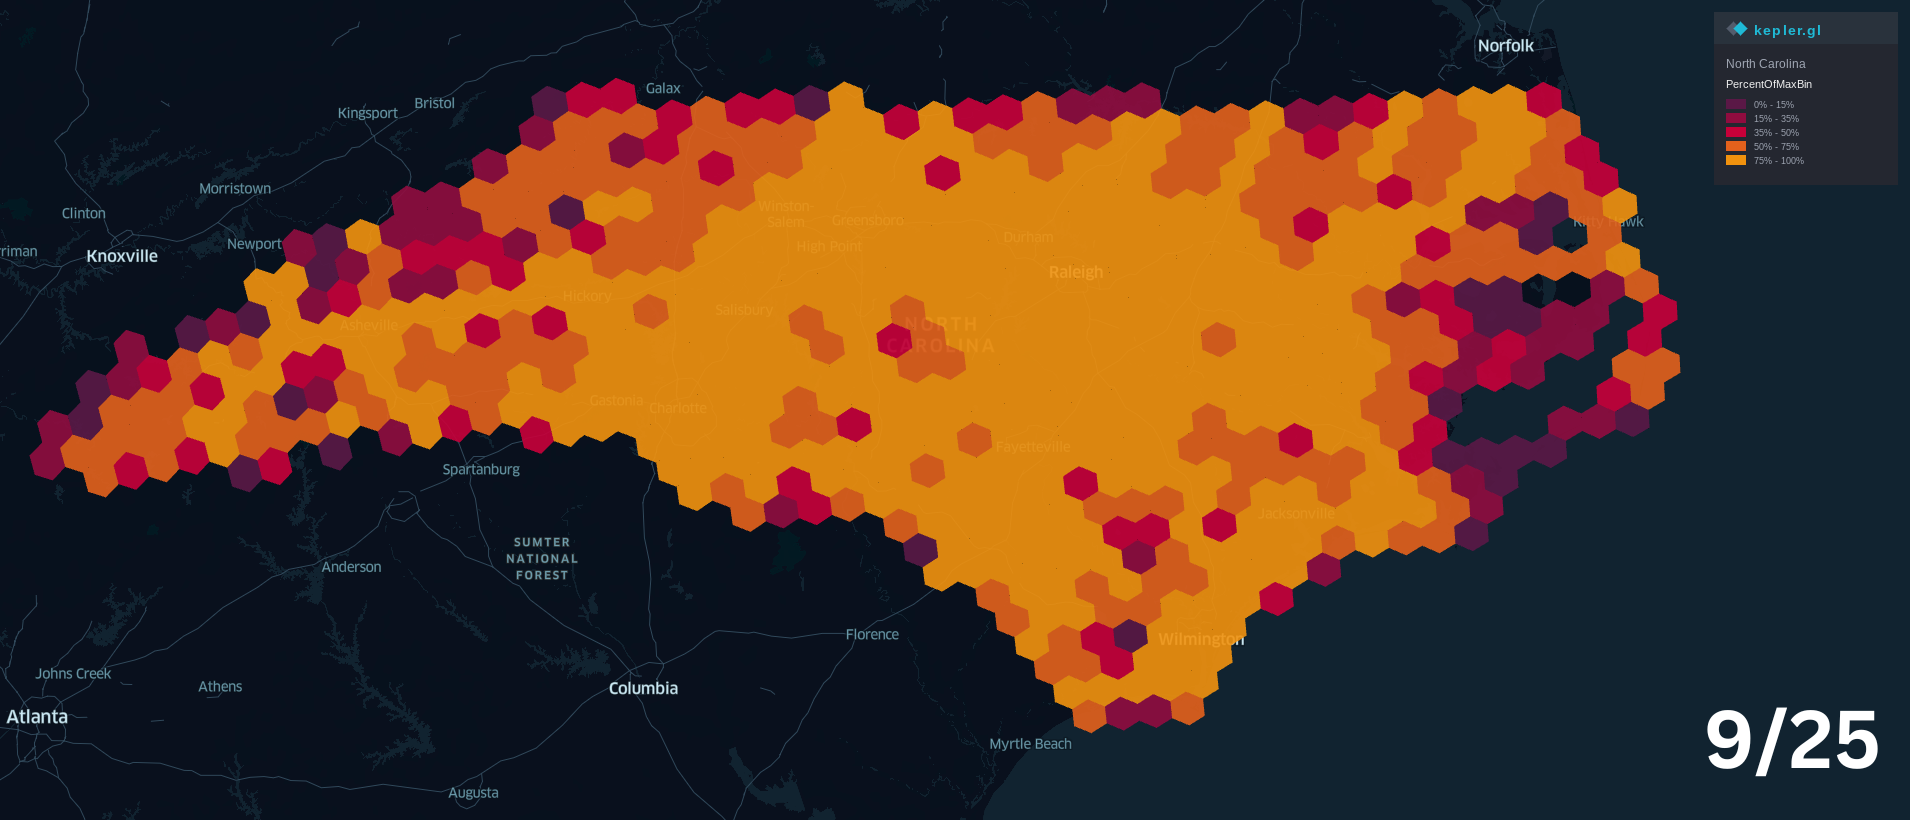
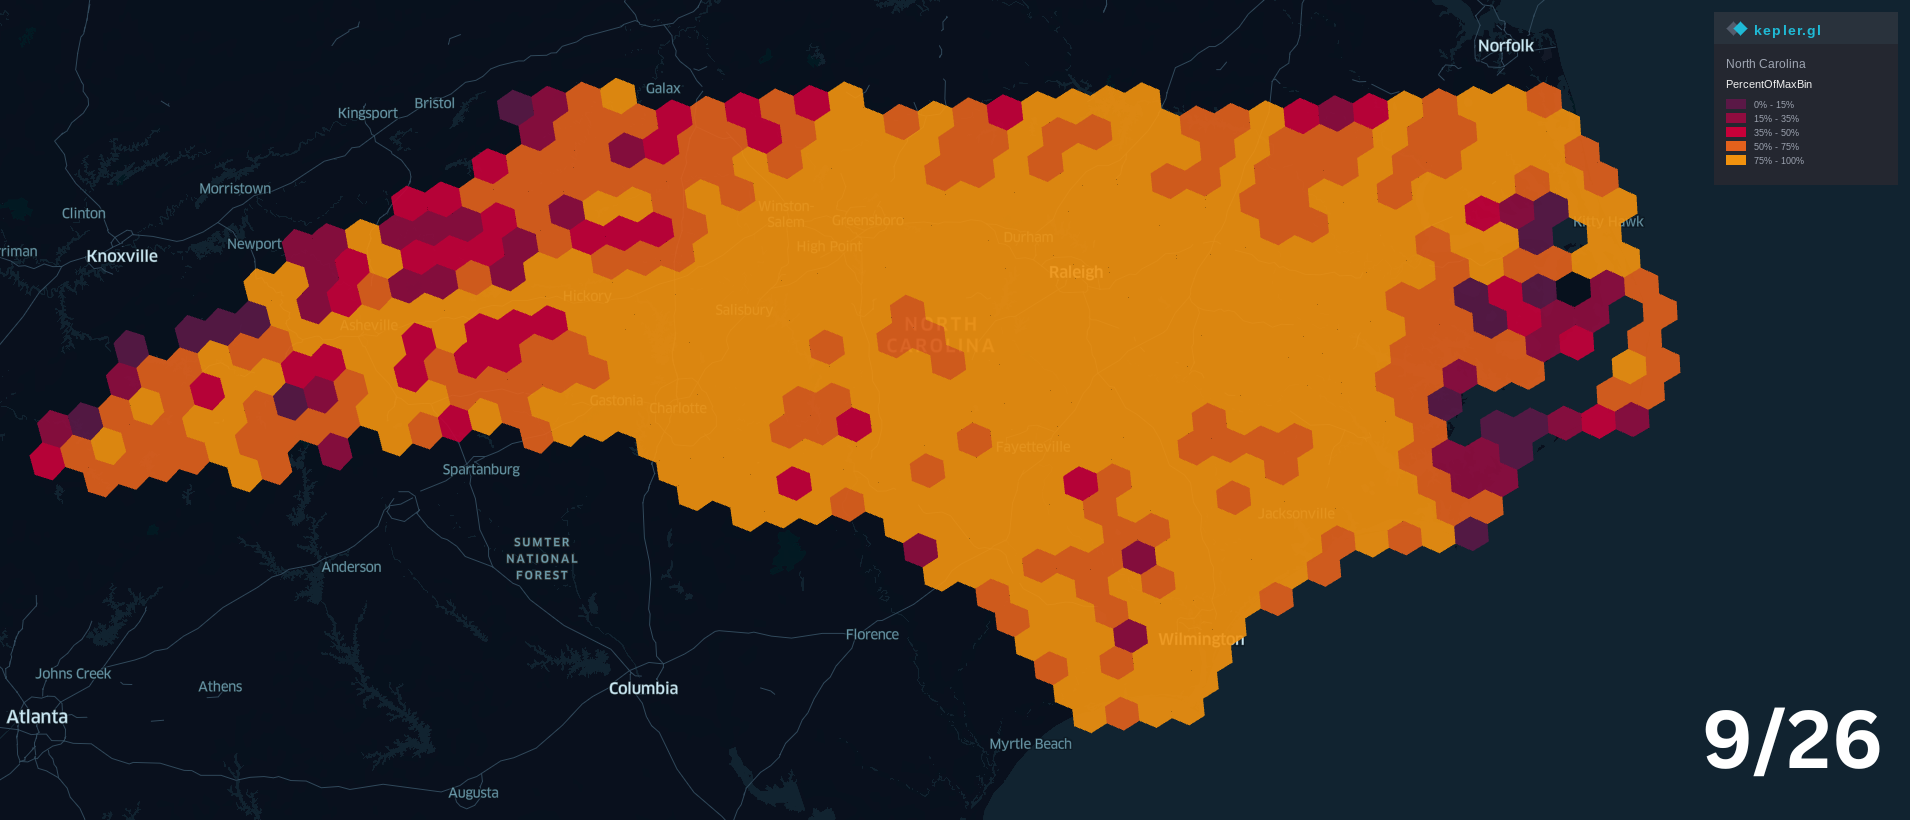
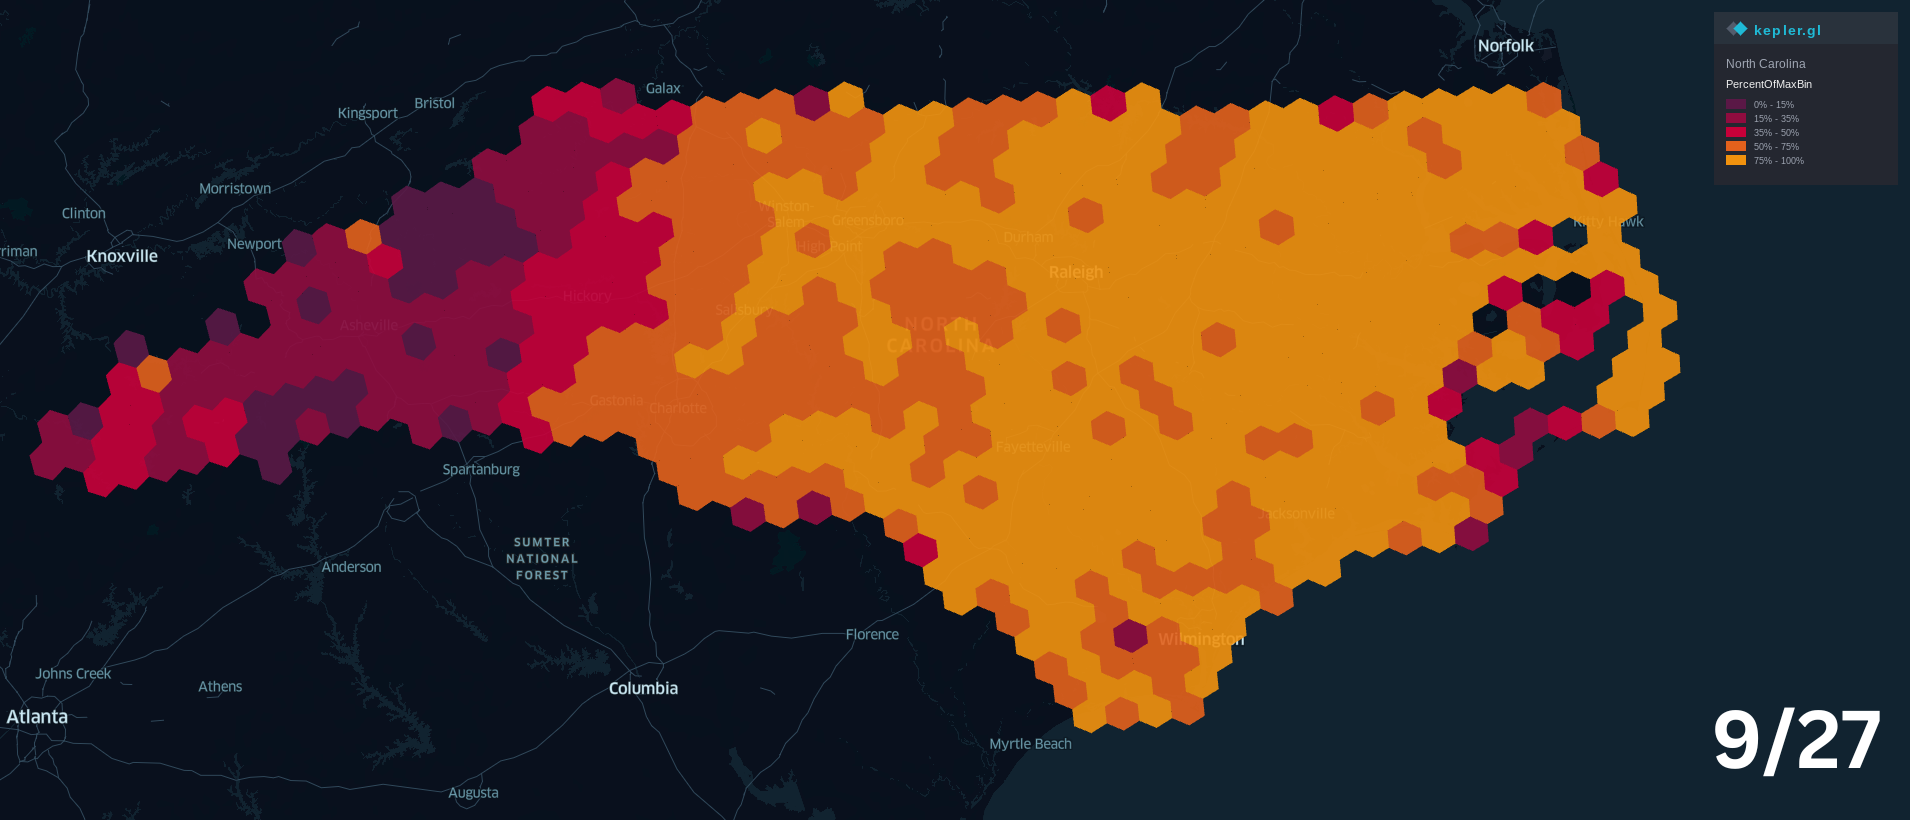
Under normal circumstances, it takes less than 30 seconds for a GO device’s data to be recorded. The maps below show the aggregate proportion of GO devices that took three minutes or longer to record data (i.e., six times longer than normal) before, during and three days after extreme weather events. Yellow areas indicate that very few devices have a slow connection, while purple indicates that a high concentration of devices have a very slow connection. The maps show that prior to the weather events, very few areas have high concentrations of devices that take three minutes or longer to connect. However, while extreme weather conditions are occurring, the geographies that are most severely impacted show higher concentrations of slow connection times.
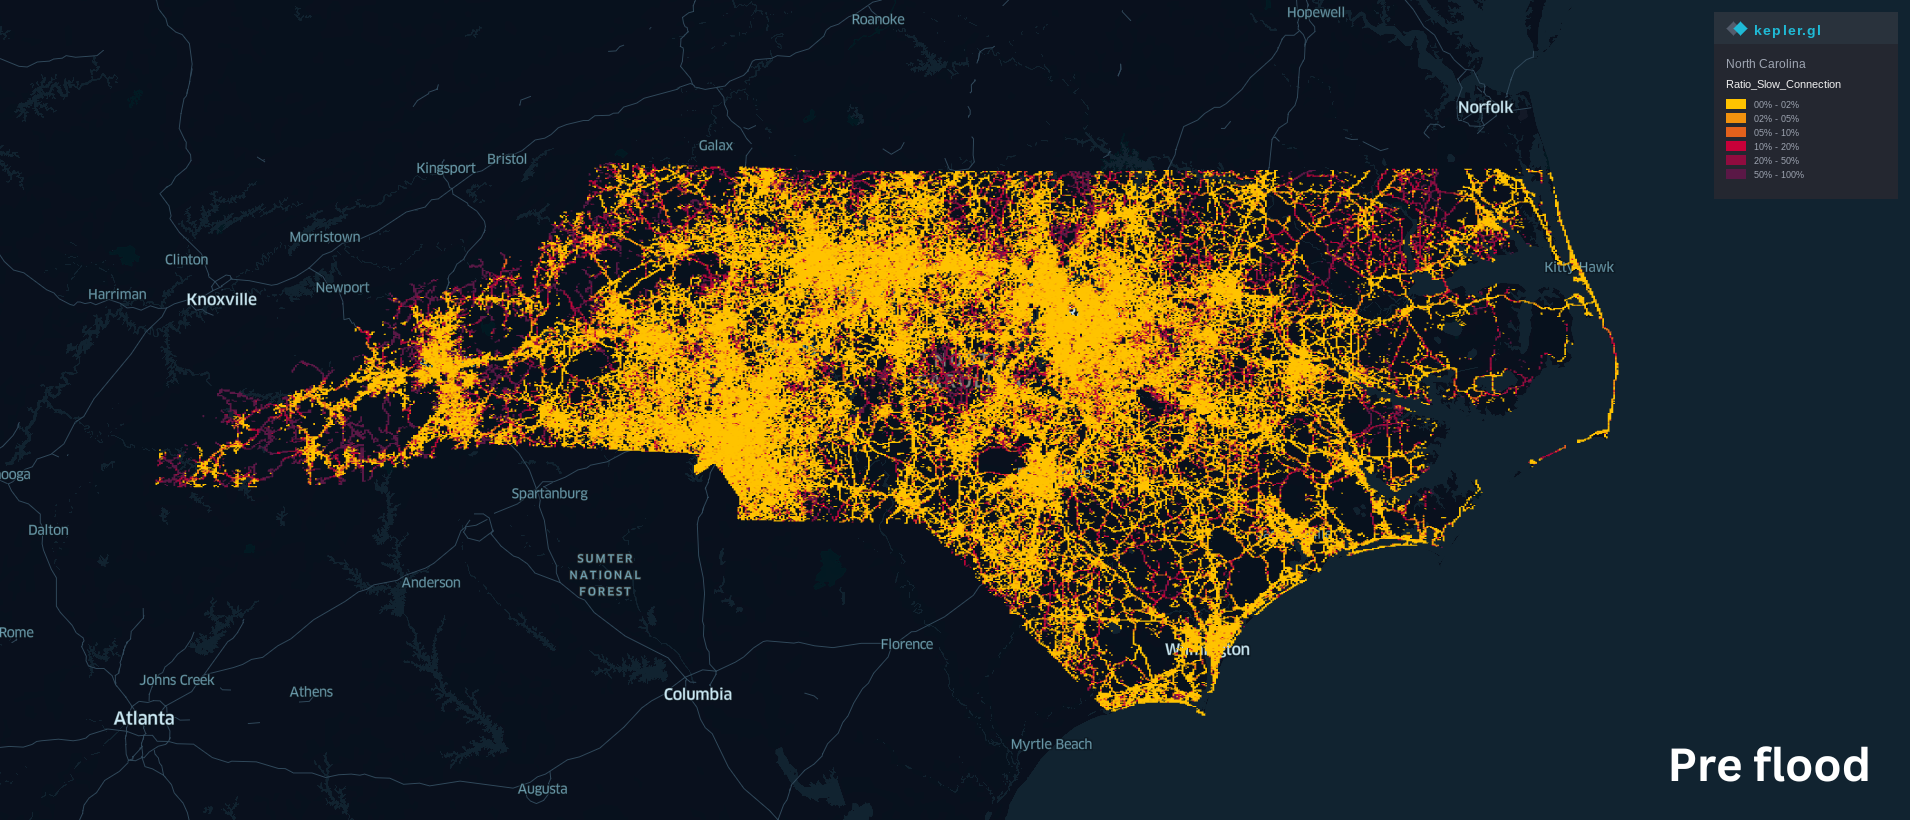
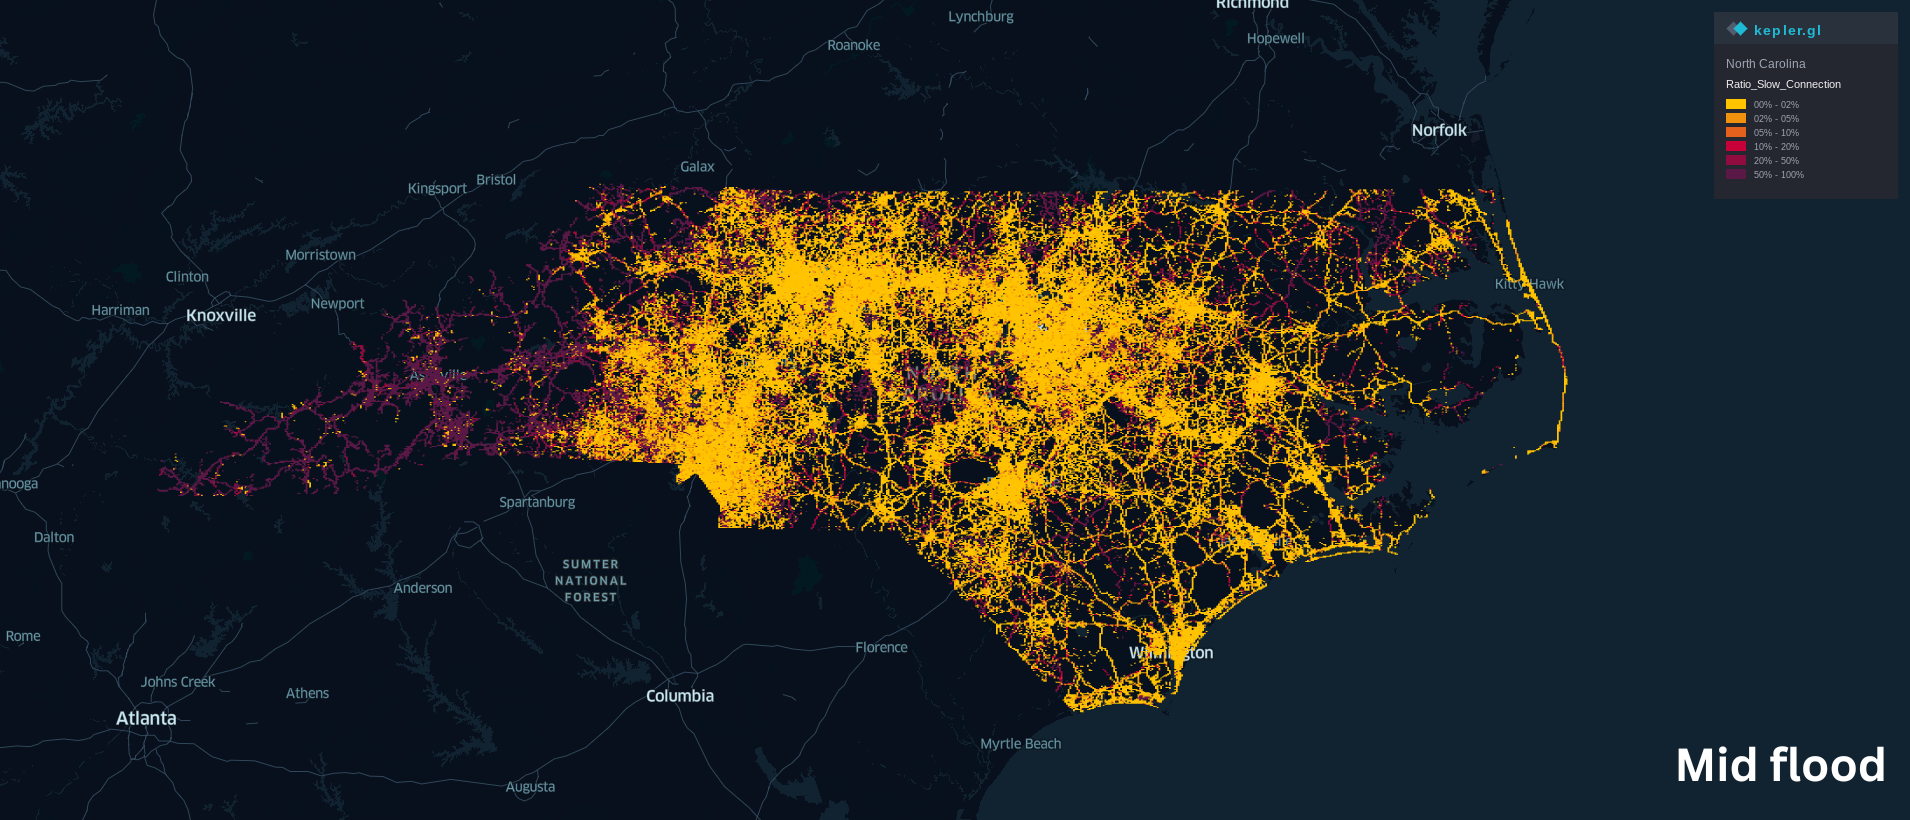
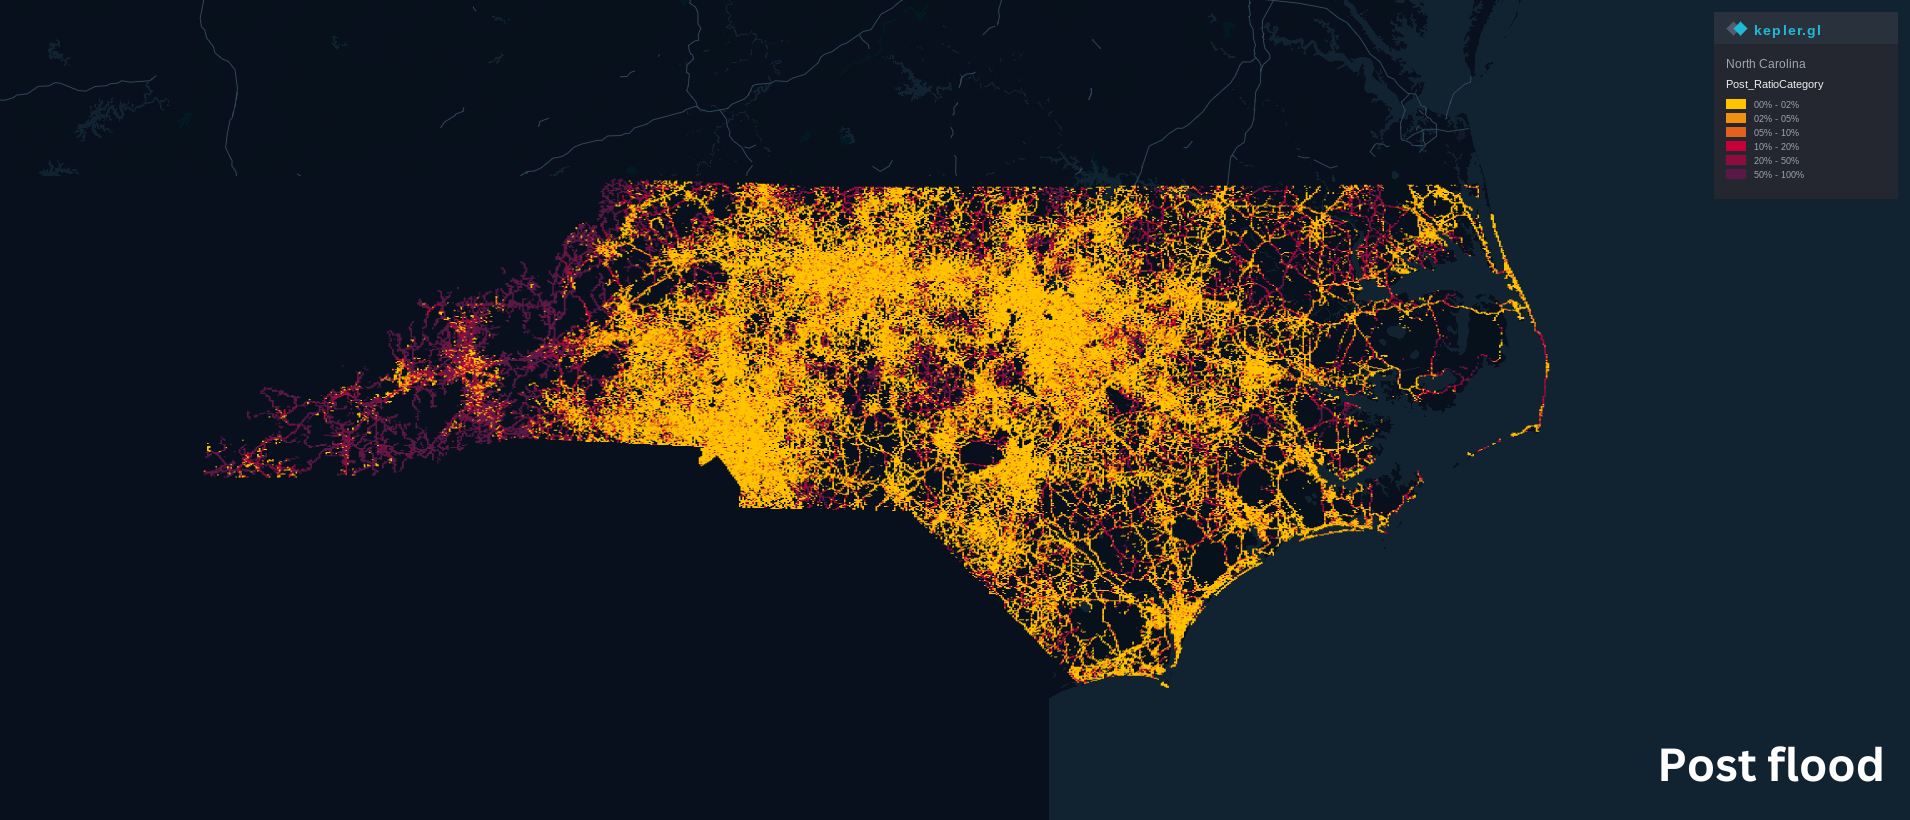
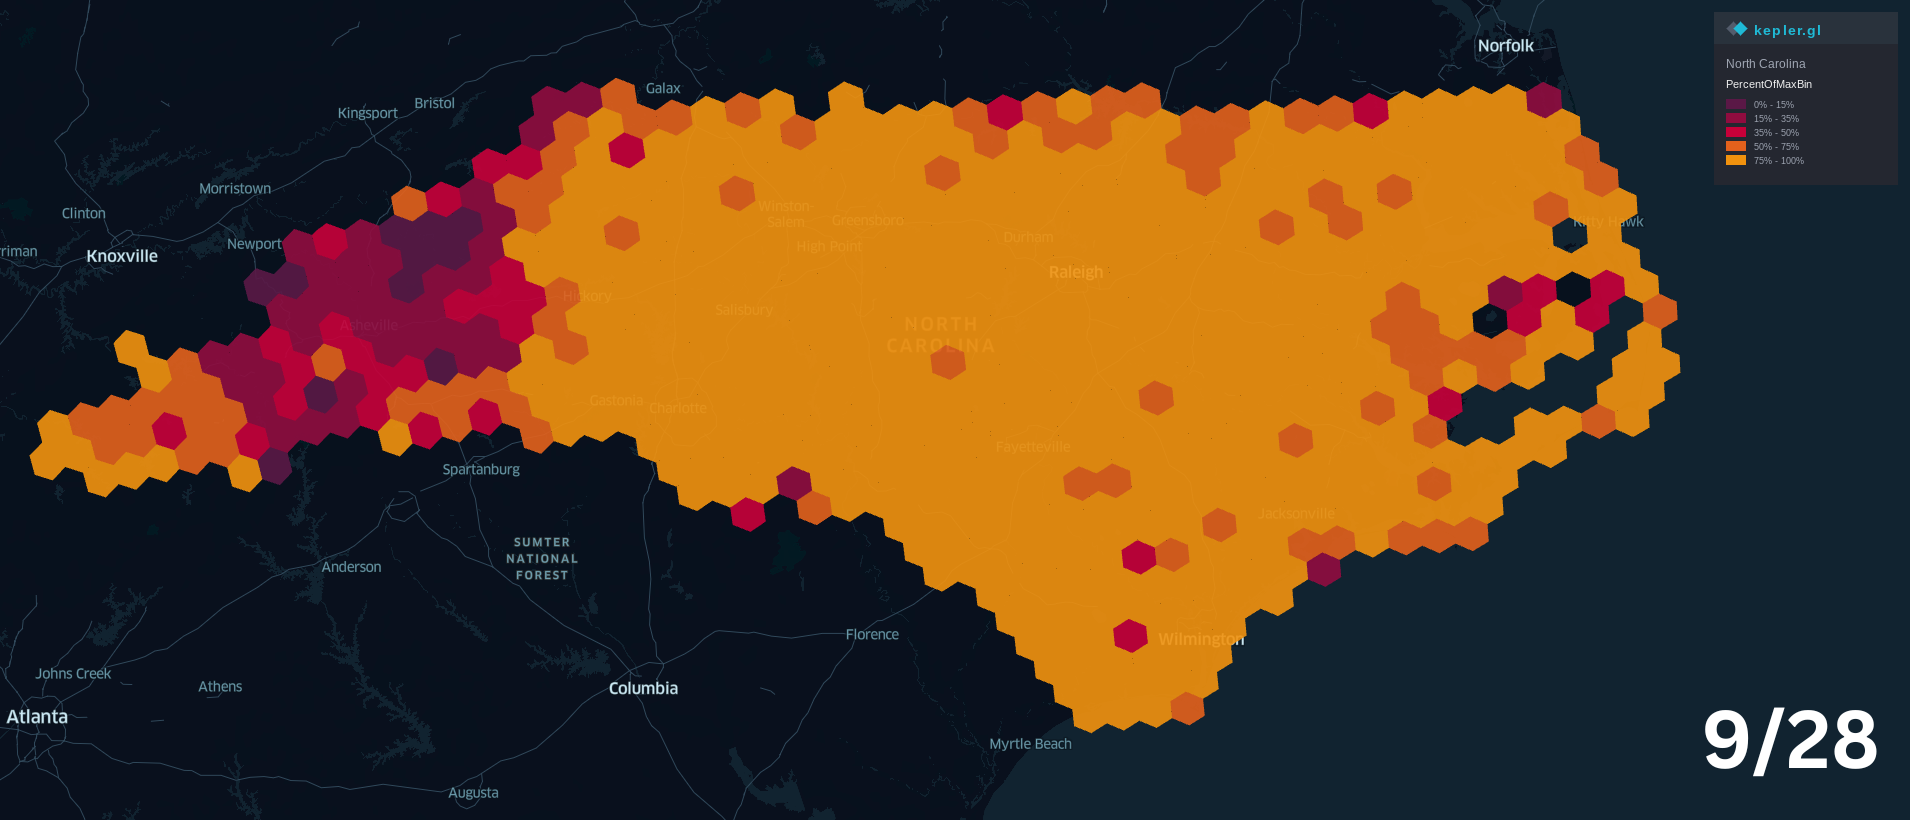
The three maps presented above show the concentrations of GO devices with a connection time of three minutes or longer. The first map, which shows the overall lowest concentration of devices with a slow connection, covers September 25-26. The second map covers September 27-28, which were days of intense flooding in the western part of the state. The map shows that the area around Asheville had a very high concentration of slow connections. The third map covers September 30-October 1 and indicates that even several days after the most intense flooding had subsided, the area continued to have relatively poor connectivity. The area immediately around the city of Asheville’s connectivity has improved compared to the days prior.
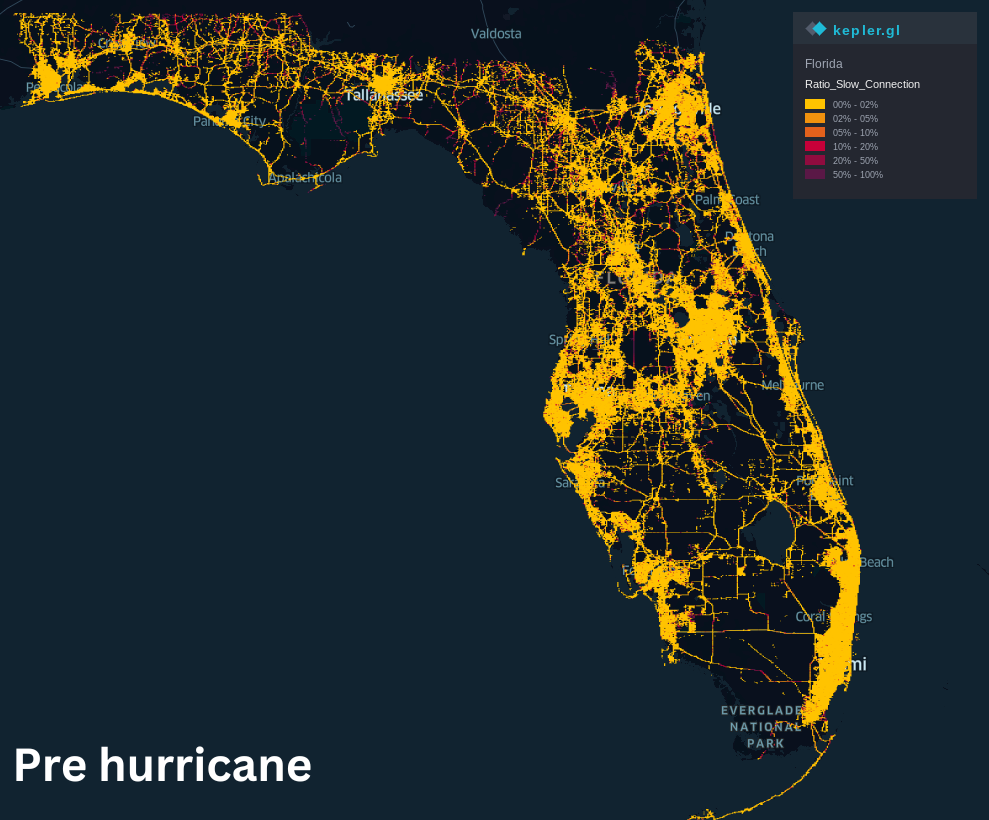
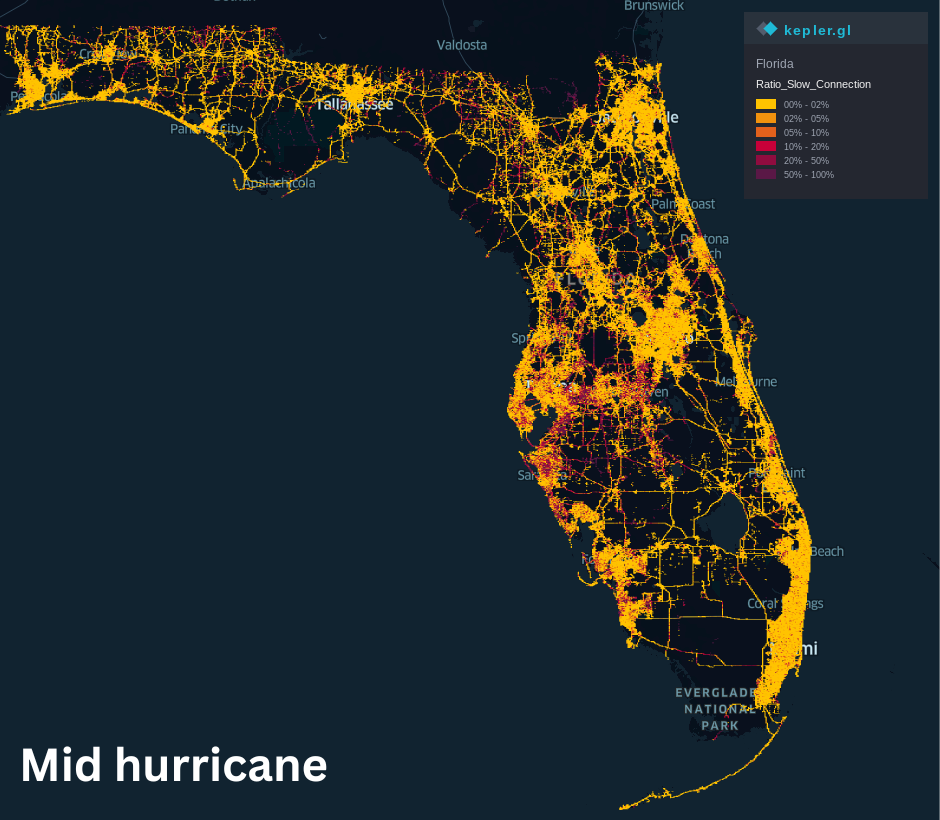
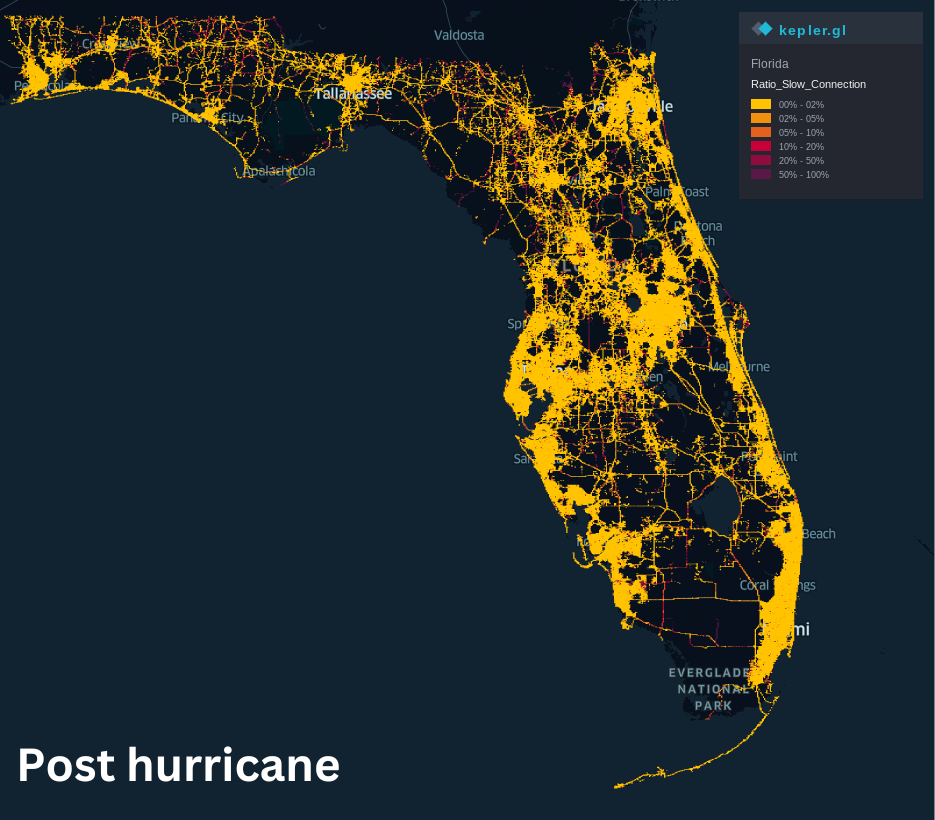
The three maps presented above show the concentrations of GO devices with a connection time of three minutes or longer in Florida. The top left map, which shows the overall lowest concentration of devices with a slow connection, covers October 8-9. The second map covers October 10-11. Hurricane Milton touched down late on the night of October 9 and proceeded to move across the state. The map shows that the area around Tampa (particularly southeast of Tampa) had a high concentration of slow connections. The third map covered October 13-14 and indicates that by this time connectivity had largely returned to normal.
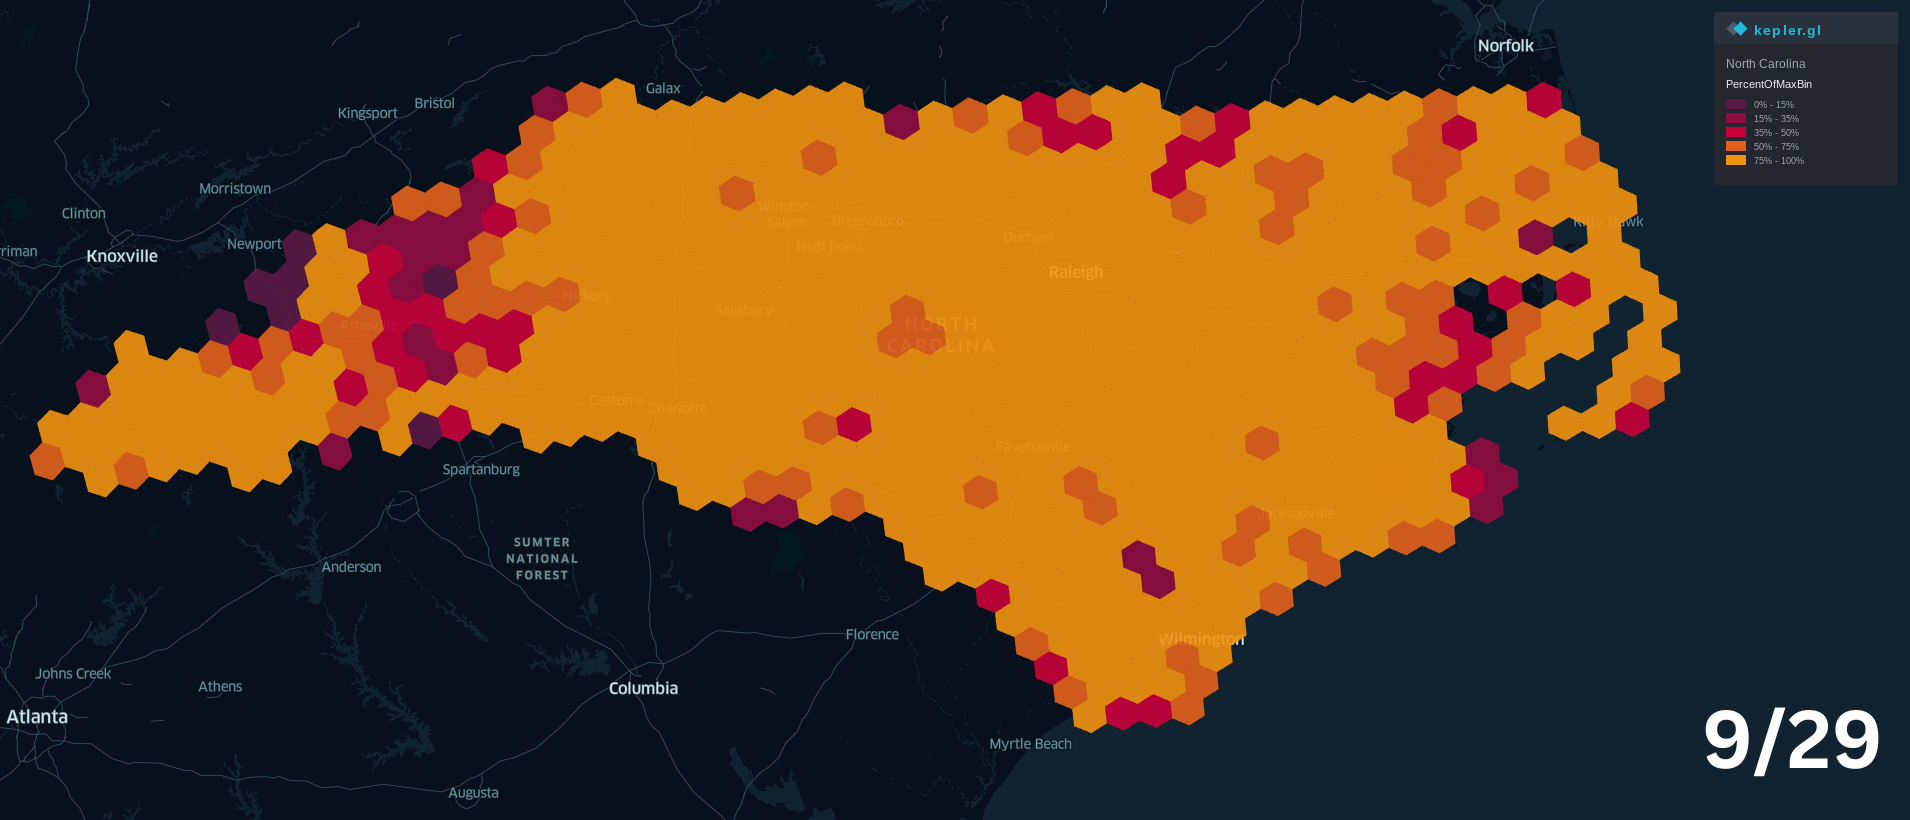
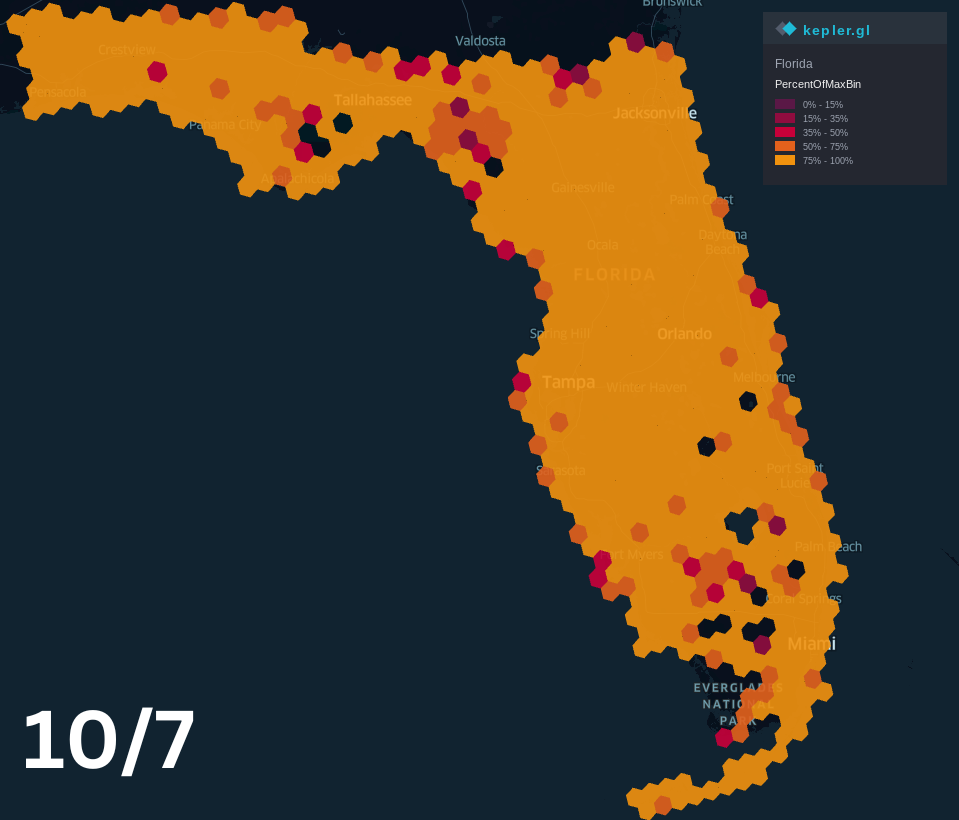
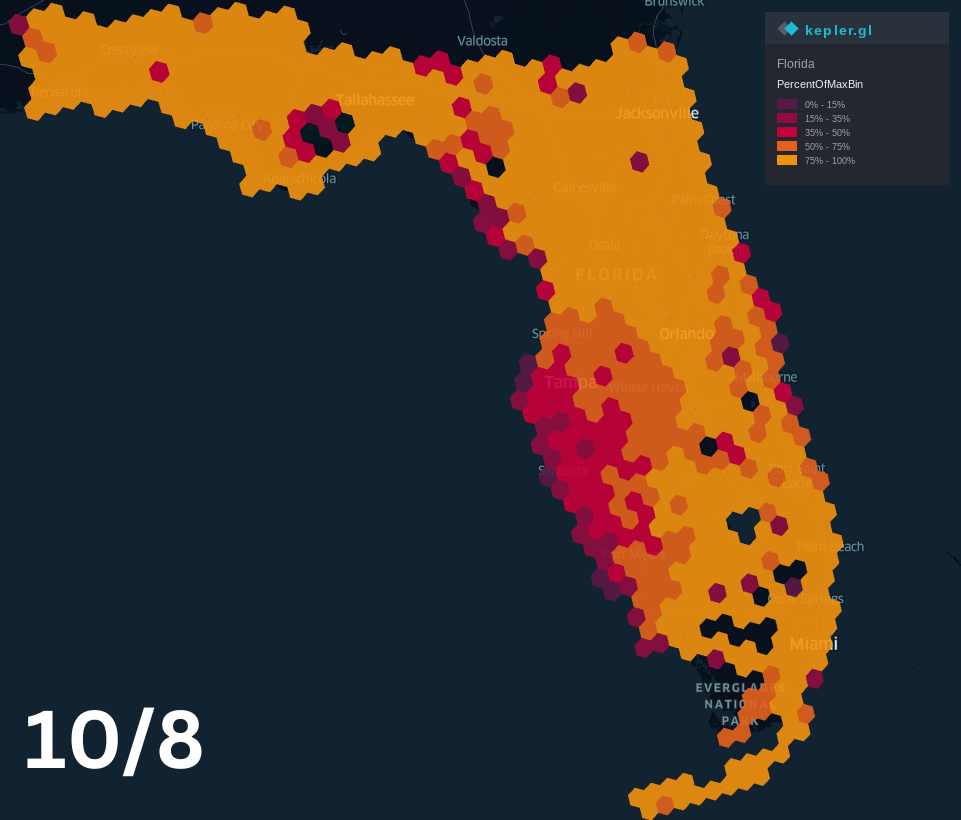
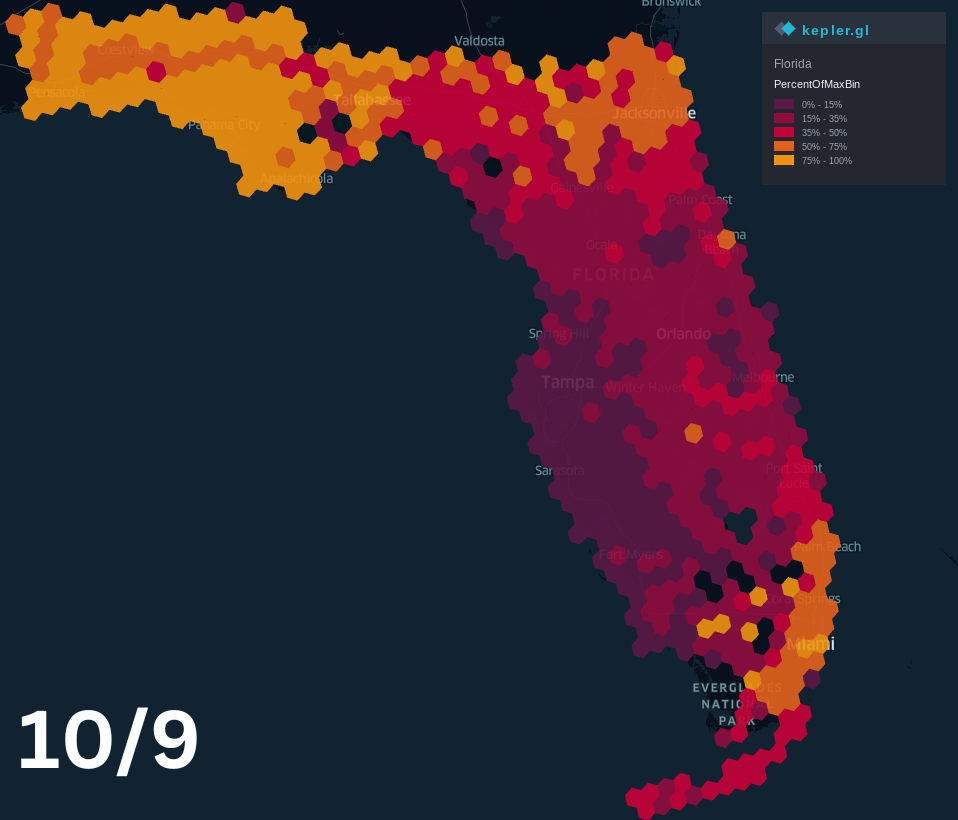
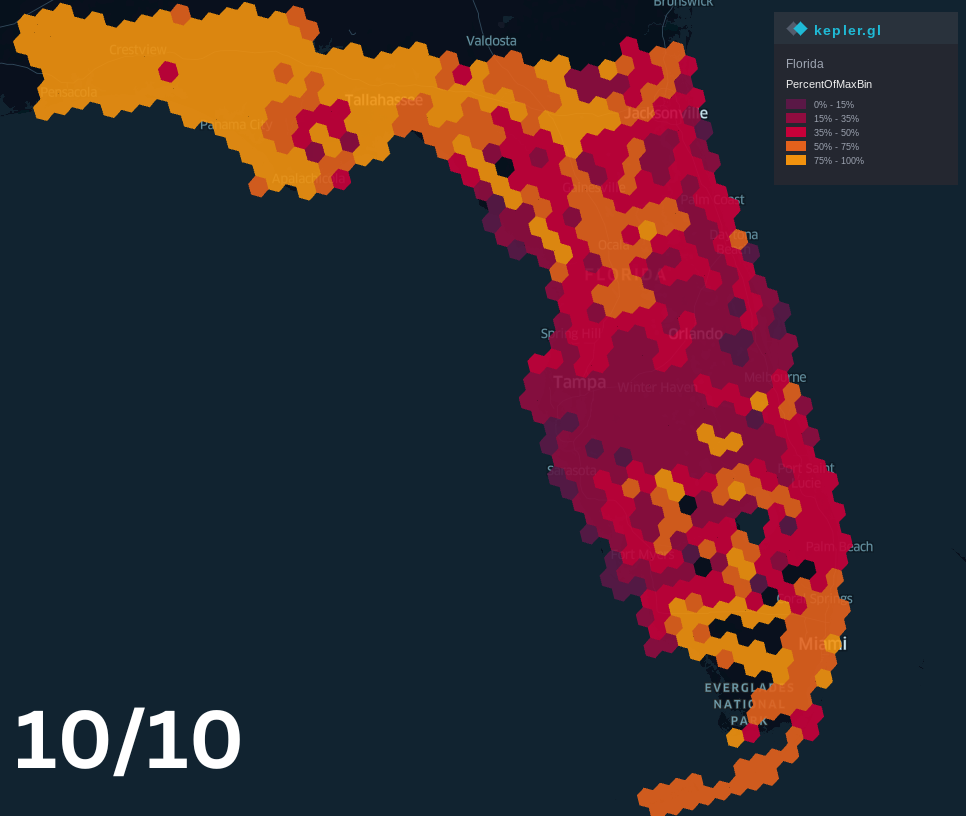
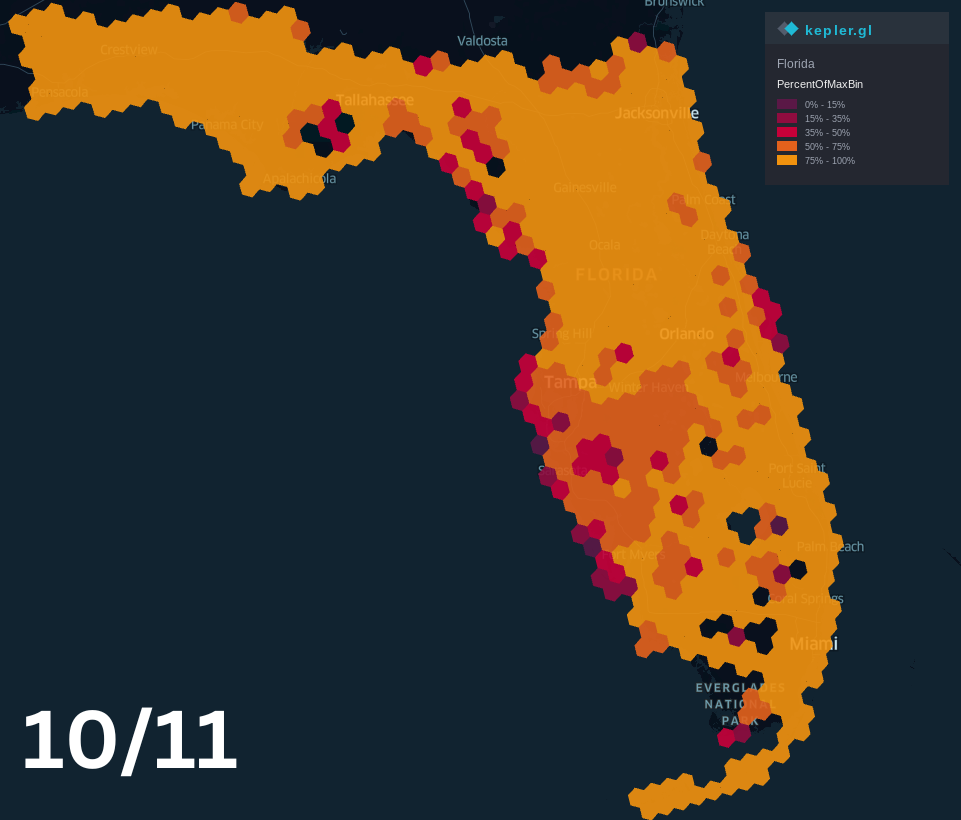
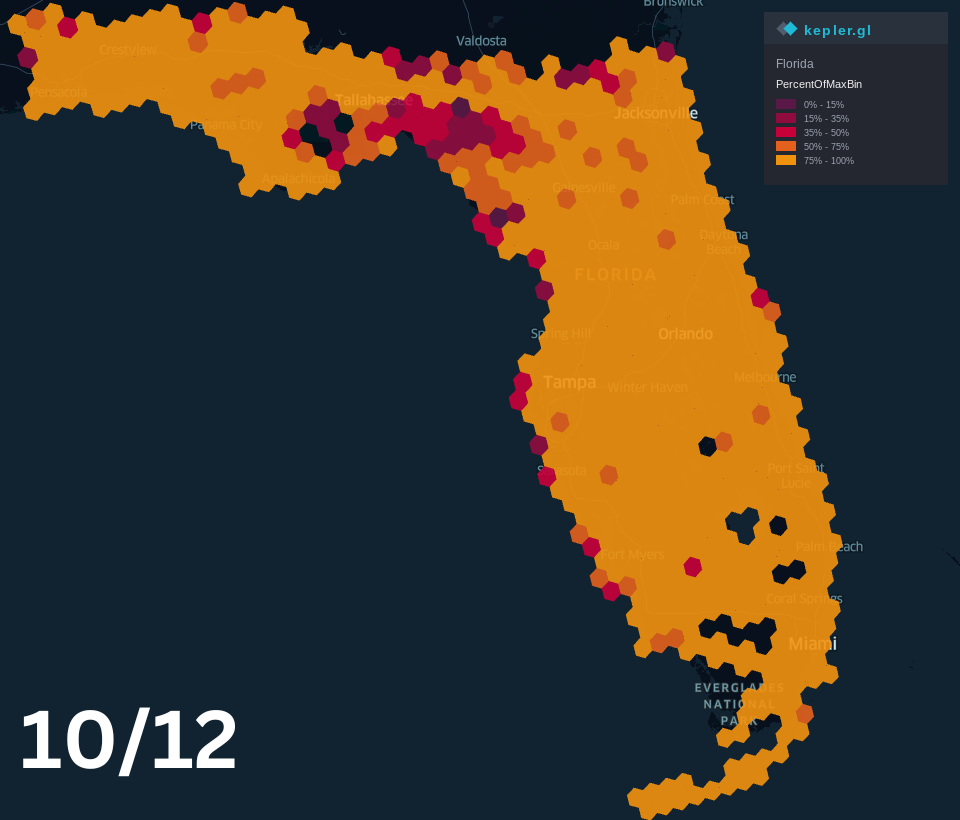
Vehicle volumes on roadways shown over time illustrate how roads are used on different days. We use vehicle volume as a percentage of maximum observed volume in order to compare the same roadways over a weeklong time span. These volume ratios can be used to understand how travel patterns vary in anticipation of impending severe weather, how limited travel becomes during the weather event and how many days after the event normal operations resume.
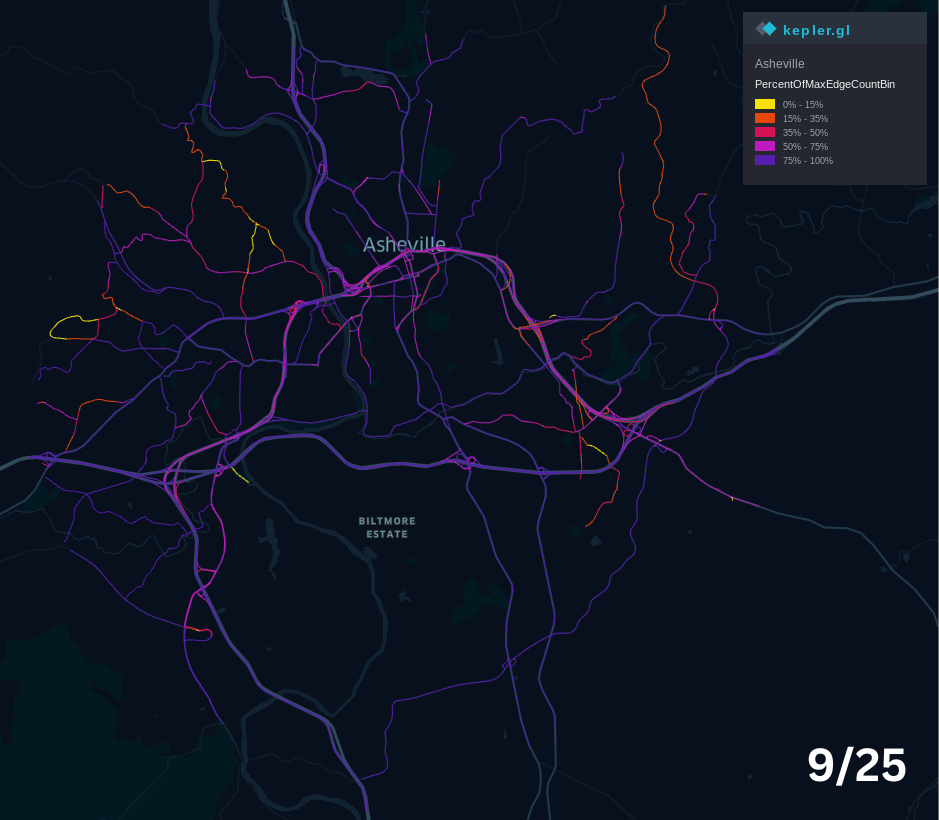
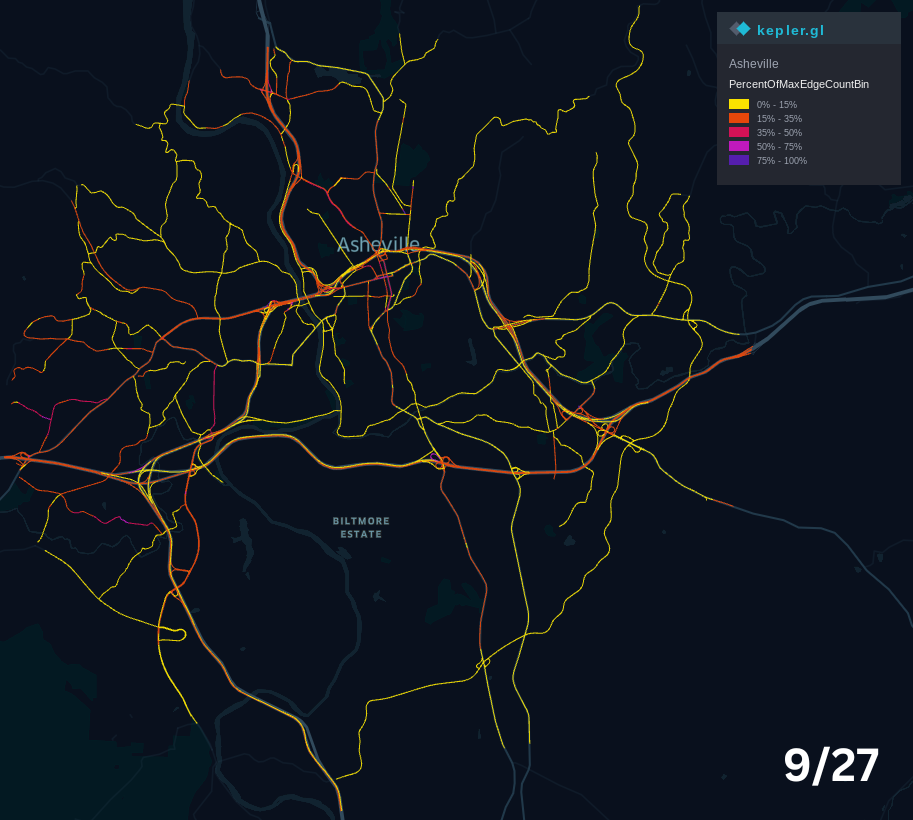
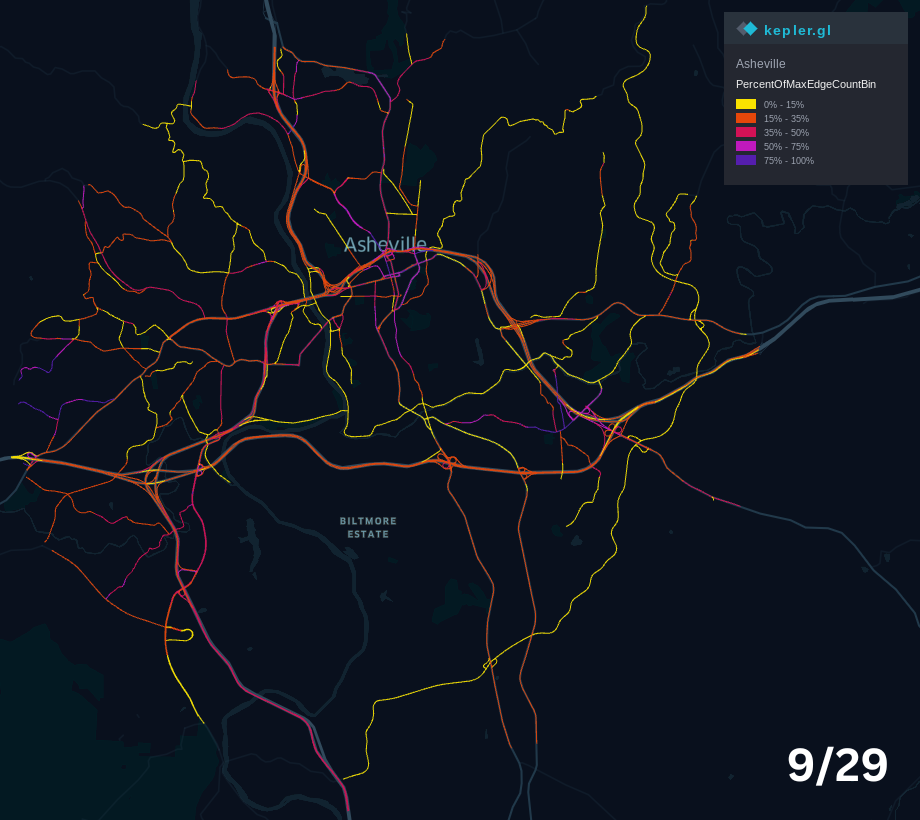
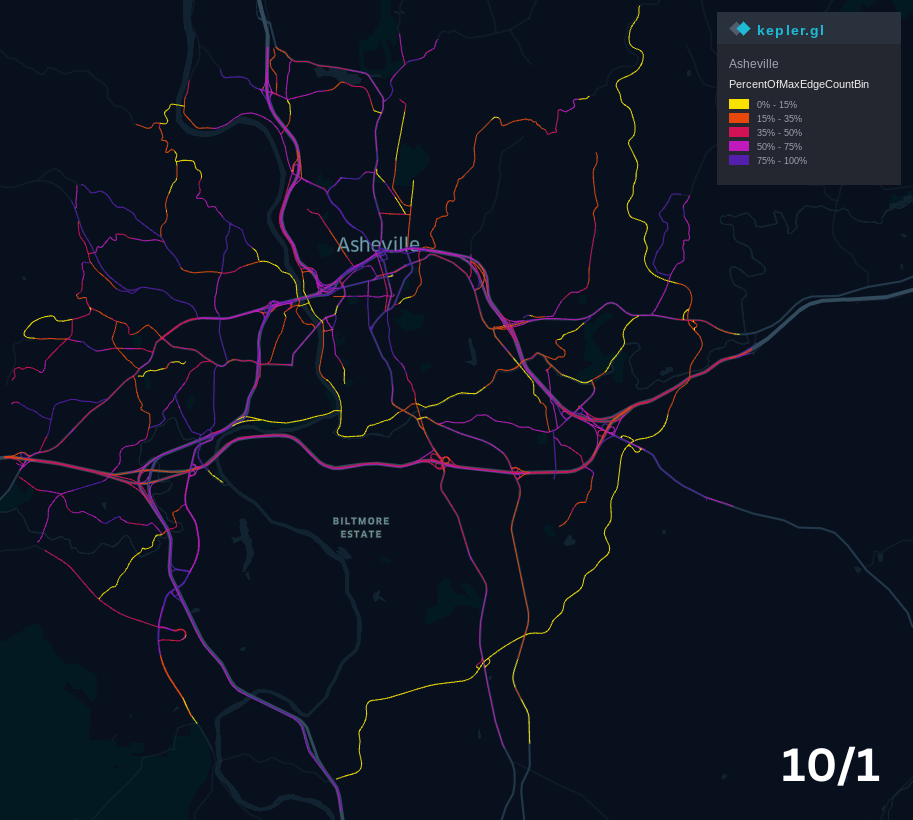
The maps above show vehicle volumes as a percentage of maximum observed vehicle volume on the days leading up to severe flooding in Asheville, the peak flood day and the days afterward. From left to right, top to bottom the dates shown are September 25, September 27, September 29, and October 1. The purple hues indicate high roadway volume, while reds and yellow indicate very low volumes. The maps indicate that a roadway going around Asheville to the southeast (the Blue Ridge Parkway) remained closed even after the majority of roads in the area reopen, further verified in this article.
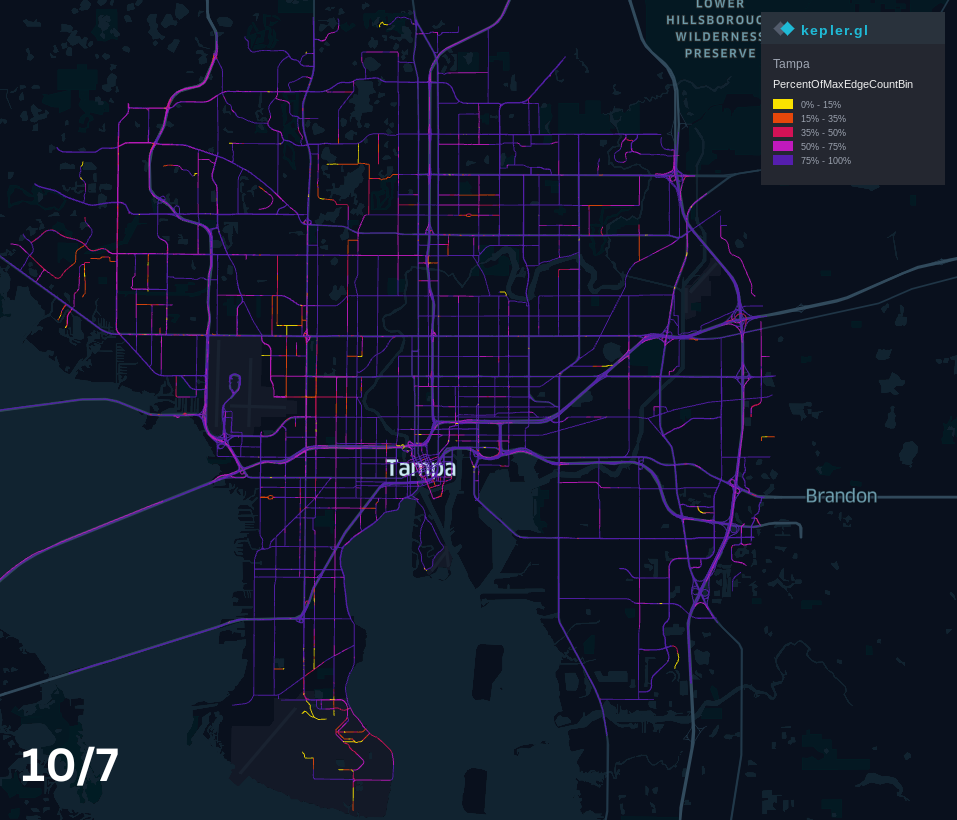

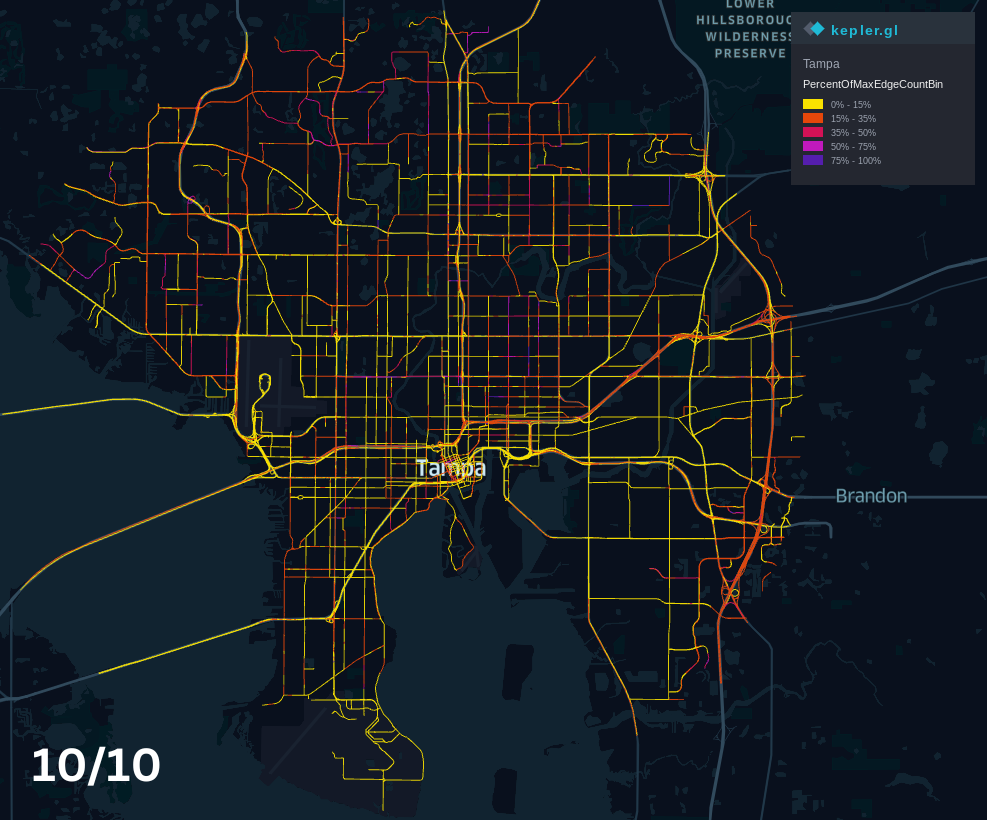
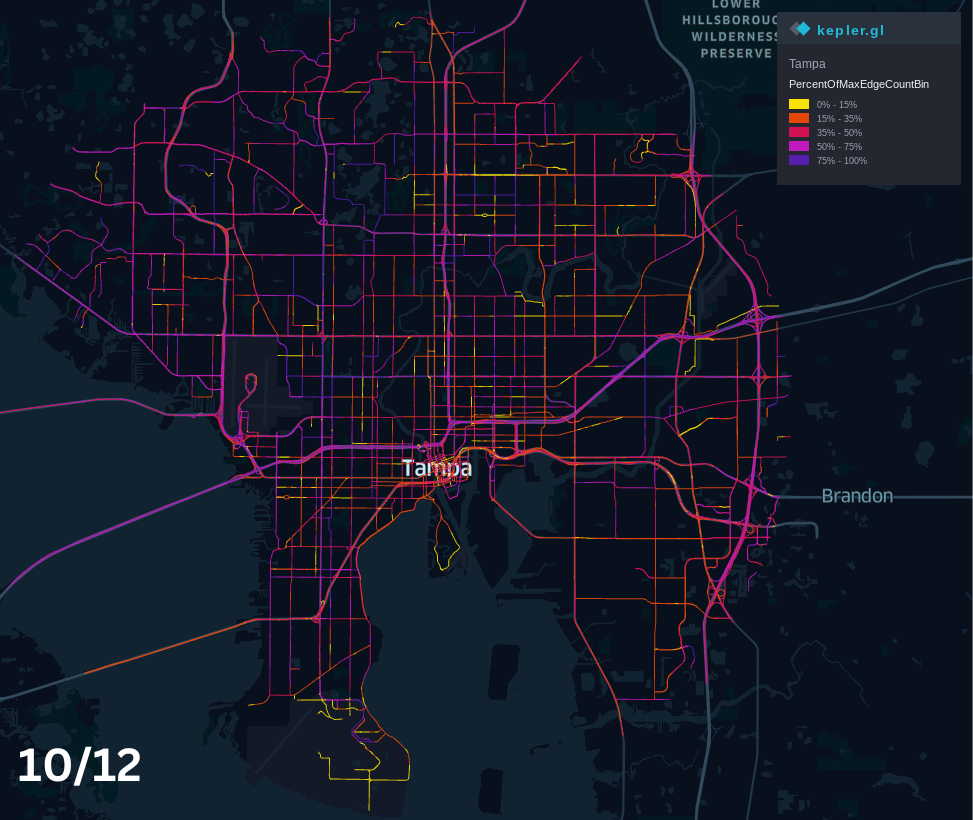
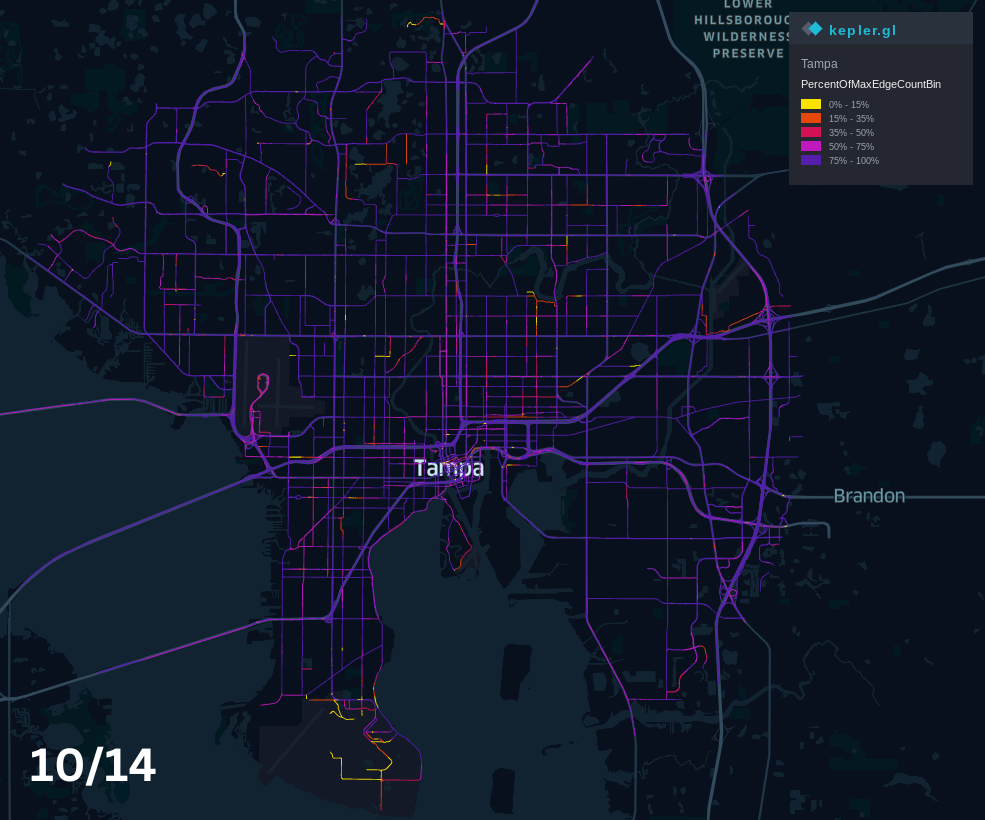
The maps above show vehicle volumes as a percentage of maximum observed vehicle volume on the days around Hurricane Milton’s arrival in Tampa. The dates shown are October 7, 9-10, 12 and 14. October 9-10 shows the lowest overall vehicle volumes, while activity fully returns to normal by October 14.
Vehicle travel hot spots show how travel patterns across a large geographic area change over time. We counted the number of vehicles that visit each sub-geography (hexagonal units covering ~98 square miles) on a given day and calculated the ratio of vehicles on a given day to the maximum number of vehicles that have visited the same area on similar days (for example we compared Wednesdays with Wednesdays). These maps show regional travel trends over time. These trends indicate preparation prior to severe weather, limited movement in areas affected by severe weather immediately preceding and during the weather events and increased travel following the events.
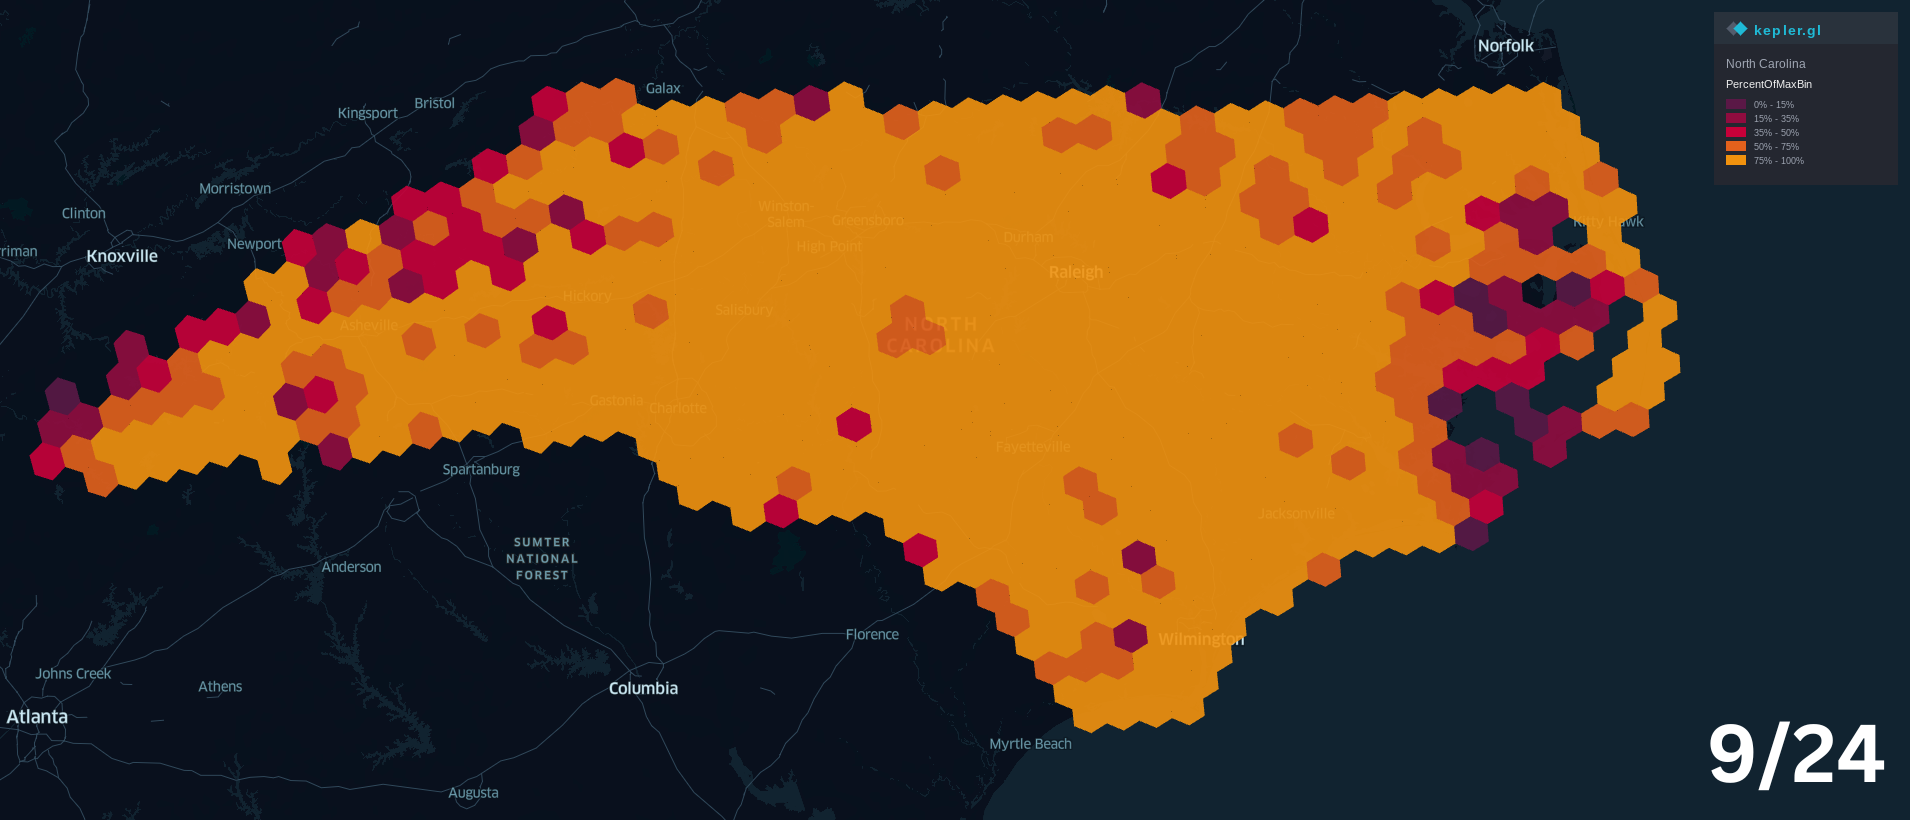
The maps above show travel hot spots (the ratios of vehicle counts in a given area on a given day compared to the max observed vehicle count in the same area) on September 24-29 (in order from left to right, top to bottom). These maps show that travel in the western part of the state was relatively low in the days leading up to the flooding event (September 27). The day of the flooding shows nearly zero activity around Asheville. Activity began to resume on September 28 and 29, gradually increasing in the Asheville area.
The maps above show travel hot spots on October 7-12 (in order from left to right, top to bottom). These maps show that travel in the central part of the state was high on Monday, October 7 prior to Hurricane Milton’s landfall on Wednesday, October 9. On that Wednesday there was very little vehicle activity, which then increased a small amount on Thursday along the northern and southern edges of the hurricane’s path. On Friday, vehicle activity had largely returned to normal but was still diminished in the Tampa region.
By using data from commercial vehicles to understand the impact of Hurricane Helene and Hurricane Milton in Western North Carolina and the central region of Florida, our study demonstrated how device connectivity lag time, roadway volumes, and travel hotspots can be used to understand roadway conditions and travel patterns before, during and after these extreme weather events. Each respective storm had significant impacts to the regions it made landfall over, and our thoughts are with all who were impacted by these tragic natural disasters. With Altitude’s insights, transportation planners can develop effective disaster mitigation plans that ease traffic and keep communities safer.
Learn more about how our commercial vehicle data can help you reduce disruptions to regional movement and protect your travelers by booking a 1:1 consultation with us.
This heavy-duty truck volume analysis shows how toll pricing differences reshape freight corridor behavior at the US-Canada border.
This heavy-duty truck volume analysis shows how toll pricing differences reshape freight corridor behavior at the US-Canada border.
Altitude by Geotab and CATT Lab bring Stop Analytics into RITIS, giving DOTs and MPOs access to observed truck stop data from 6 million commercial vehicles.