Transportation data guides better real estate site selection by backing choices up with evidence of consumer behaviors. Using insights around customer travel tendencies and preferences gives companies confidence that their projects will work.
- Choosing high-potential areas: Base real estate or development decisions on travel data from your ideal customer profiles. By validating where your target buyer is coming from and most frequently going, you can place new business locations in optimal areas.
- Gaining a competitive foothold: Stake your business’s claim in a prime real estate area before your competition can and be the first to attract new customers. Capture new business by securing the best real estate available.
- Allocating resources efficiently: Align your business resources and objectives with data-driven indicators. Study vehicle patterns and demand to validate business hypotheses. Evaluate the effects of a business decision based on the data to plan better for future projects.
- Testing a pilot of EV chargers: Fuel stations and convenience store businesses can use data to choose the best spots to add a small number of EV charging stations and test the results of doing so before potentially rolling them out across all their locations nationwide. Capture new customers by installing EV charging options at your stop centers.
- Identifying the total addressable market: Home improvement companies, department stores and larger retailers can analyze traffic data to assess the whole potential market in a new area by surveying traffic data. See the total volume of commercial vehicles in an area and infer where smart investments could be made as a result.
Here are three primary examples of using transportation data for optimized site selection.
Example #1: Market Analysis

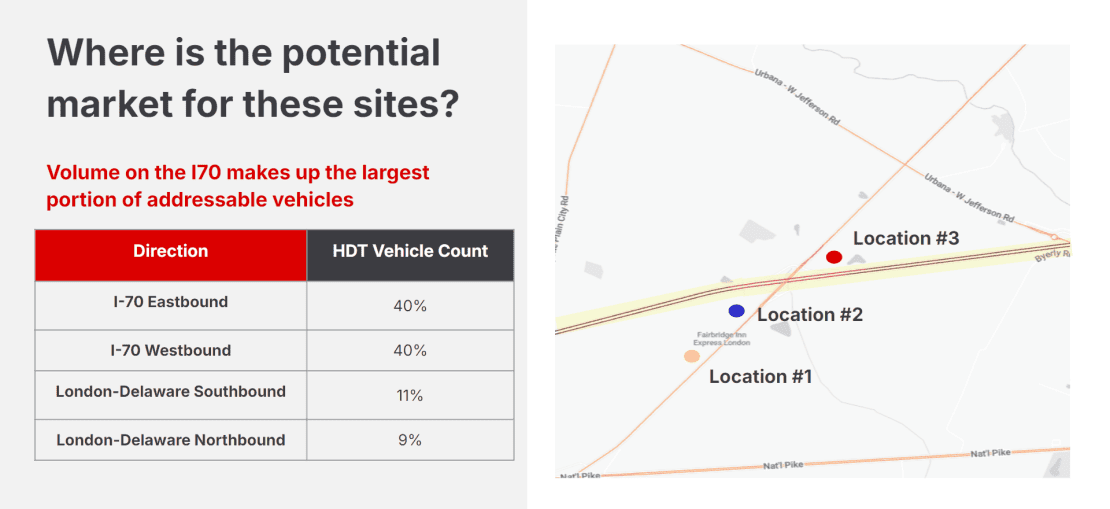
This map breaks down the potential addressable market for a new business location based on heavy-duty vehicle counts. Knowing which directions these vehicles are moving helps organizations such as fuel companies place new sites on the sides of the most traffic-heavy roads.
Example #2: Travel Volume Analysis

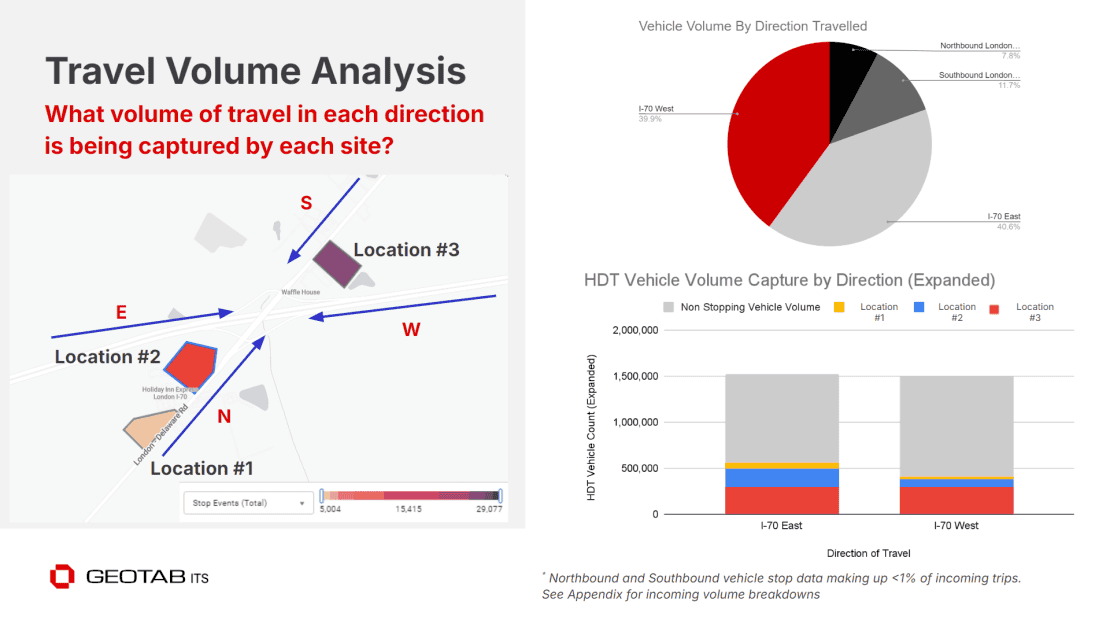
This visualization shows where traffic is heading in relation to three different sites and additionally highlights key differences in overall vehicle volume. The bar graphs detail the vehicle stop breakdowns at each location, helping a company understand how much traffic competing locations might be receiving compared to theirs.
Example #3 – Stop Locations

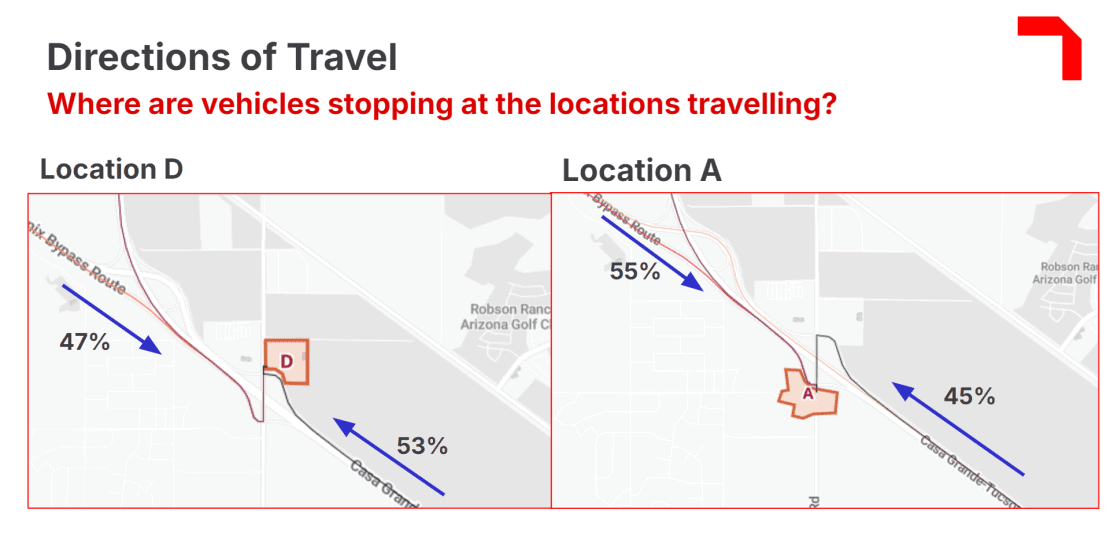
Maps showing the disparity in vehicle stops for two competing businesses’ locations along the same road. Location D is seeing a higher percentage of stops from vehicles traveling north westbound, while Location A is experiencing a higher share of stops for vehicles moving south eastbound. Knowing which direction of traffic is contributing to a majority of a location’s business helps companies better understand consumer behaviors and tailor their strategies accordingly.


