For petroleum and gas companies, choosing the right location for their next opportunity can make or break their investment. In this piece, we’ll highlight how Altitude’s aggregated commercial transportation insights can help you select the best location for your next truck stop, convenience store or commercial refueling station.
In the competitive petroleum and gas industry, selecting the right location for a new commercial gas station is critical to maximize traffic and revenue. Traditional site selection methods often rely on fragmented data and guesswork, which can lead to riskier investments and potentially saturated markets. But what if you could move beyond those uncertainties and leverage commercial transportation insights to identify high-potential fueling locations? With aggregated commercial vehicle data, you can. By analyzing these insights you’re able to gain a holistic view of regional mobility patterns, drive confident, informed expansion decisions and mitigate financial risks.
Stop guessing, start growing: Leverage contextualized commercial vehicle data for strategic site investments
Basing a site selection decision on disparate or non-granular datasets can be immensely costly because the average gas station costs $1-3 million to construct. If a location doesn’t have the proper insights or research to justify the investment, it may fail to perform well and result in significant financial losses. Fragmented data hinders smart investment decisions by not providing the context needed to know how commercial motor vehicles (CMVs) are truly behaving. By using contextualized insights, you can understand the “why” behind CMV movement through vehicle types, vocations and classes and make more informed decisions.
In the downstream petroleum and gas industry, this context is like striking gold when determining where the best location for a new commercial gas station should be. Context removes guesswork from the mix by helping you see where your target customers are traveling from, where they’re headed and what vehicle types are traveling most frequently along a region’s road networks. Proving a strong business case for a new location doesn’t have to be hard, but it is a decision that sometimes must be made quickly due to similar competitor interests in a particular site. That’s why it’s so important to act fast, but with a calculated and precise approach. Using a transportation analytics platform, you can make more strategic truck stop location decisions, boost stakeholder confidence and help position your expansion projects for success.
The race is on: Secure high-potential fueling locations with holistic transportation insights
Choosing a prime location for your next truck stop, commercial gas station or convenience store is a time trial against your competition to lock down the location before they can stake a claim to it first. And while a transportation analytics platform can help you determine what CMVs are doing, it can also reveal what competitors in the region are up to, ultimately providing you with a competitive edge.
The Altitude platform is our turnkey transportation analytics solution that provides contextualized CMV insights. With the power of our platform, your petroleum and gas company can gain a holistic view of what CMVs are doing, benchmark locations against competitors or compare potential sites against one another to assess performance and market saturation levels. By doing this level of research with our insights, you can avoid potential market overcrowding and the risk of over-investing in areas already rife with competition.
Visibility into regional traffic movement and how often commercial vehicles stop can help you determine whether a potential area is underserved or overserved, estimate likely demand and even account for competitive pressures like food services or electric vehicle (EV) charging stations. Additionally, you can leverage our insights to benchmark your current truck stop locations via and forecast revenue projections for a new location based on current traffic levels. Altitude is the ultimate tool for both competitive intelligence and smarter market expansion.
Using Altitude’s mobility insights for confident commercial gas station expansion
In the following four examples, we’ll show you how mobility insights from Altitude are able to help you conduct a confident and effective truck stop location analysis.
Total addressable volume
Identify potential market share in areas of interest by using Altitude’s vehicle miles traveled
(VMT) data. These insights can help you quantify the total commercial vehicle populations in a state, province or region. Our maps use color-coded shades to show accurate VMT counts (extrapolated with Expansion Factors) and enable you to see if enough potential customers are traveling throughout an area to warrant building a new commercial gas station or truck stop.

An example of Altitude’s VMT counts in Arizona. Regions of the state with higher concentrations of VMT are highlighted in darker shades of red.
VMT by road segment
Studying VMT values by road segments can help pinpoint road segments or corridors with high activity, allowing you to conduct more precise gas station site selection with granular analytics. In the example below, we’ve highlighted how three road segments in particular highlight better potential areas for development, based on higher VMT totals observed.

An example of VMT data by road segment in Casa Grande and Eloy, Arizona within Altitude. The darker and closer to purple a road segment is, the more observed VMT counts there are.
Competitive market analysis
To assess competitor presence in an area you’re looking to expand into, it’s critical to do a competitive market analysis with transportation insights. Altitude provides aggregated mobility insights, allowing you to visualize stop event patterns near key junctions or road segments. You can also analyze aggregated heavy-duty vehicle counts to understand customer visitation trends at other fuel stops. Equipped with this information, you can more accurately forecast how expansion into an area might affect CMV visits to competitor convenience stores, commercial fuel stations or truck stops, and where challenges with attracting traffic to your new location might crop up.
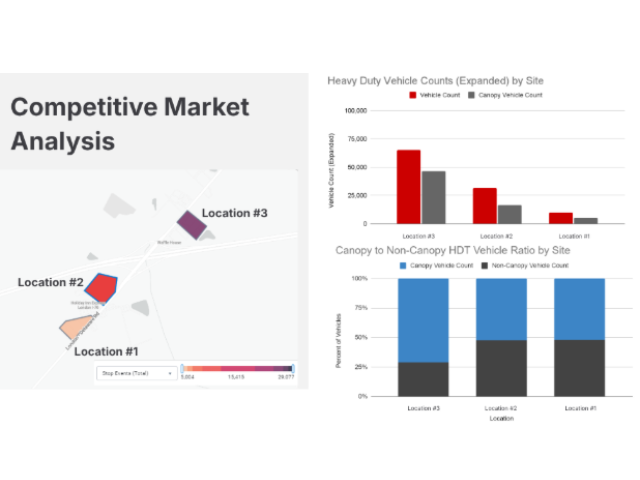
An example of a competitive analysis involving insights from Altitude. There are three different fuel stop locations (each owned by a separate petroleum and gas corporation), with vehicle counts for each broken down by canopy and non-canopy heavy-duty vehicles.
Origin and Destination data
The final component of a well-informed fuel station location analysis is researching where vehicles are coming from and where they’re headed. Placing your next location along or near interstates that are the most frequently traveled—particularly between major cities—will give you more opportunities to capture new business and establish your location as a cornerstone of the entire region’s supply chain. For example, Altitude’s Origin and Destination data uses hex maps to make it easy for you to see where most CMVs are starting and ending their journeys. With this information, you can help avoid potentially placing your next commercial gas station far away from popular arrival or departure routes.

A visual example of where most CMV journeys in the southwestern United States are originating from, as well as which routes trucks are most frequently traveling along. We’ve broken down the percentage of journeys across four major routes in the corresponding table.

Another visualization of how Altitude’s Origin and Destination insights reveal popular next destinations after CMVs have completed their initial routes. To get back to their domiciles, CMVs need adequate commercial fueling station options to exist along the key departure routes they take. Pairing these insights with competitive intel and VMT data by road segment can help you identify prime location candidates for your next development.
Drive confident decisions: How Altitude by Geotab delivers a comprehensive view of commercial vehicle movement
Altitude ultimately helps you eliminate fragmented datasets and can provide everything your petroleum and gas company needs to choose its next location with precision. With our platform’s Stop Analytics module, you can understand where CMVs are currently stopping most frequently for rest, foodstuffs or fuel. Our Regional Travel Metrics’ VMT data and annual average daily traffic (AADT) insights additionally help you evaluate the total market within specific geographies. Pairing all these insights with Origin and Destination data can provide you with a truly holistic view of regional CMV movement, enabling your petroleum and gas company to pinpoint high-traffic corridors with limited fueling options and make more informed siting choices. Help boost stakeholder confidence and buy-in, avoid risky, ill-informed investments and strategically expand with research backed by real-world mobility data.
Learn more about how Altitude can help petroleum and gas companies enhance site selection intelligence by visiting our industry page.