Keeping our finger on the pulse: Cross-border freight and port activity tracker
Update: Sept 4, 2025
Update from Nate Veeh – AVP of BD, Altitude by Geotab
US-Canada Land Border Activity: A Commercial Vehicle Perspective of Tariff Impacts
Recent data on commercial vehicle movement at U.S.-Canada land borders shows a story of stability in the heavy-duty freight sector, while showing some notable shifts in other vehicle types. Our analysis uses anonymized and aggregated commercial vehicle data to provide a clearer picture of cross-border activity over 2024 and 2025.
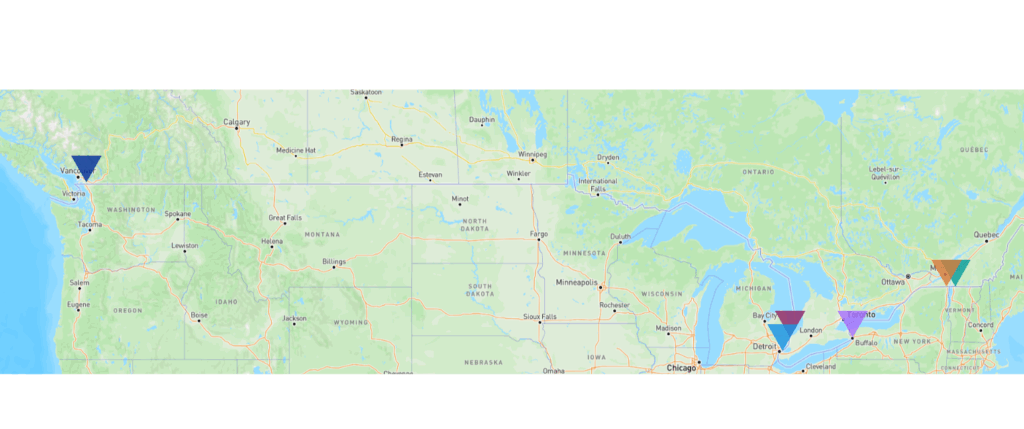
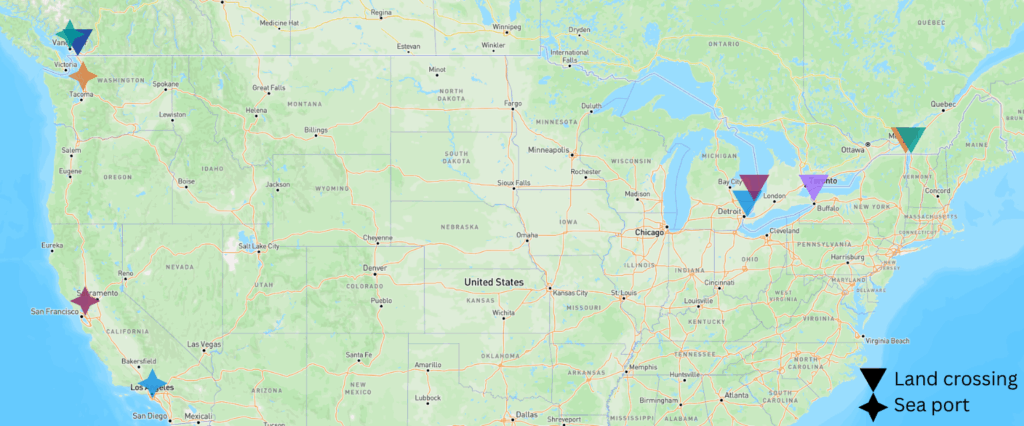
The 6 border crossings shown above were considered in our analysis due to the high volume of freight that passes through these areas.
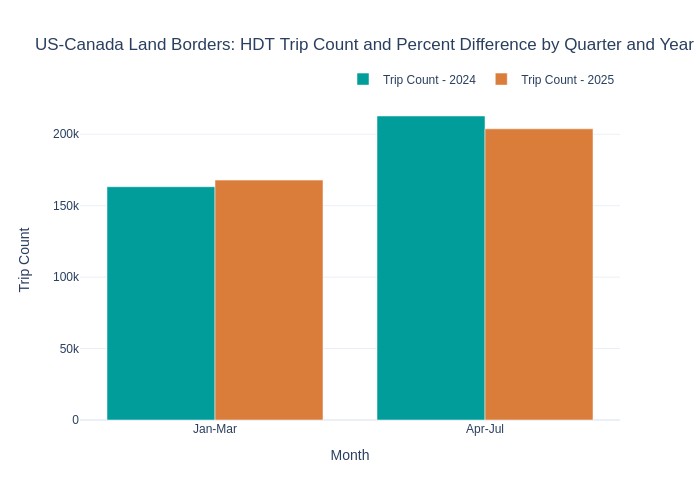
Heavy-Duty Trucks Remain the Backbone of Trade
Heavy-duty trucks continue to dominate cross-border traffic, accounting for approximately 80% of all trips between the two nations. This underscores their critical role in North American supply chains.
Despite a year of turbulent tariff changes and evolving economics, our data shows no significant changes in the number of trips made by heavy-duty trucks in 2025 compared to 2024. It also highlights that the trucking industry and overall supply chain between Canada and the US remains strong, with very little minor changes between 2024 and 2025, despite the potentially serious implications of constantly evolving tariffs.
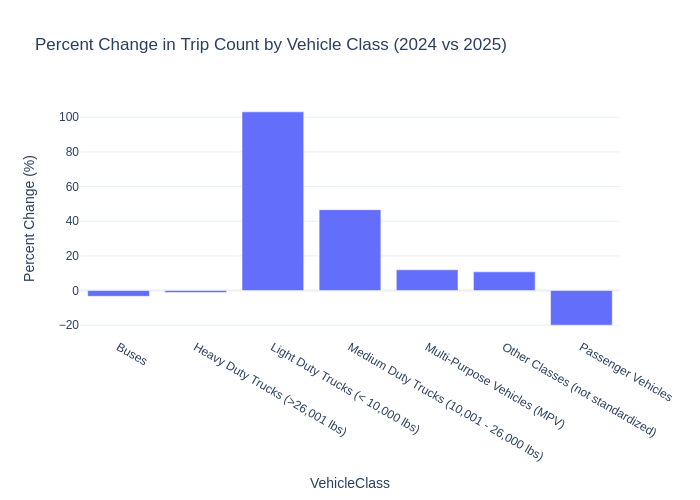
Shifts in Light-Duty and Passenger Vehicle Activity
While the stability of heavy-duty truck movement is the main takeaway, a closer look at other vehicle classes reveals some interesting trends. It is important to note, however, that because heavy-duty trucks comprise such a large majority of all trips, the changes observed in other vehicle classes are not as significant when it comes to overall commercial vehicle activity.
Light-Duty Trucks: Data indicates a distinct increase in the movement of light-duty trucks across the border in 2025 compared to 2024. This could be influenced by a variety of factors, including the growth of last-mile delivery services or small-scale commercial operations that rely on smaller vehicles.
Commercial Passenger Vehicles: In contrast, cross-border activity for passenger vehicles showed a noticeable decrease. This trend, while not impacting the flow of commercial goods, highlights a divergence in travel patterns and may be related to changes in tourism and border policies.
Public discussion around tariffs has raised concerns about potential effects on international commercial vehicle movement, but we would like to tell the story using our insights. Altitude by Geotab’s aggregated insights show that commercial vehicle volumes between the U.S. and Canada and at west coast ports have remained mostly the same in early 2025, despite growing attention. But stability doesn’t mean inactivity. Trade dynamics often move moderately or in response to specific policy milestones, and we expect that any freight effects may surface at a later time. Even without real-time border wait time data, Altitude provides a reliable, aggregate view of commercial vehicle movement across major crossings and at the ports. This comprehensive view gives us a valuable baseline for comparison as the situation evolves. Our team will continue to stay updated on the tracker’s trends and report our insights, which are able to help infrastructure, safety and supply chain planners stay informed as real-world impacts are felt.
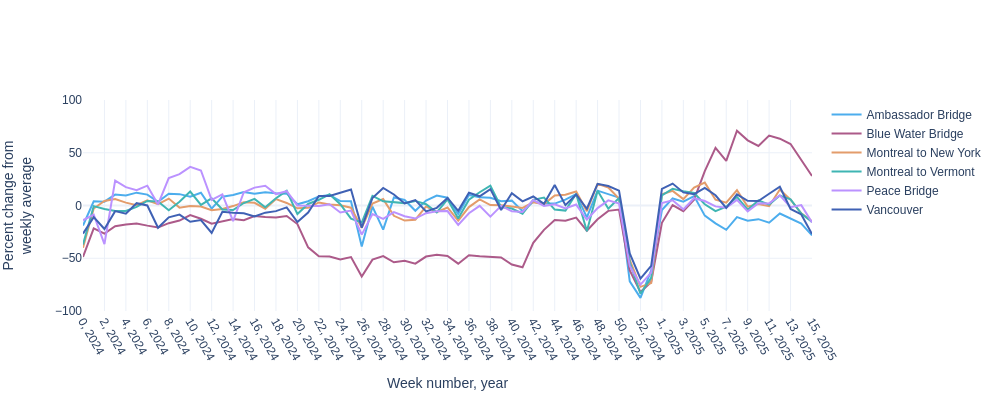
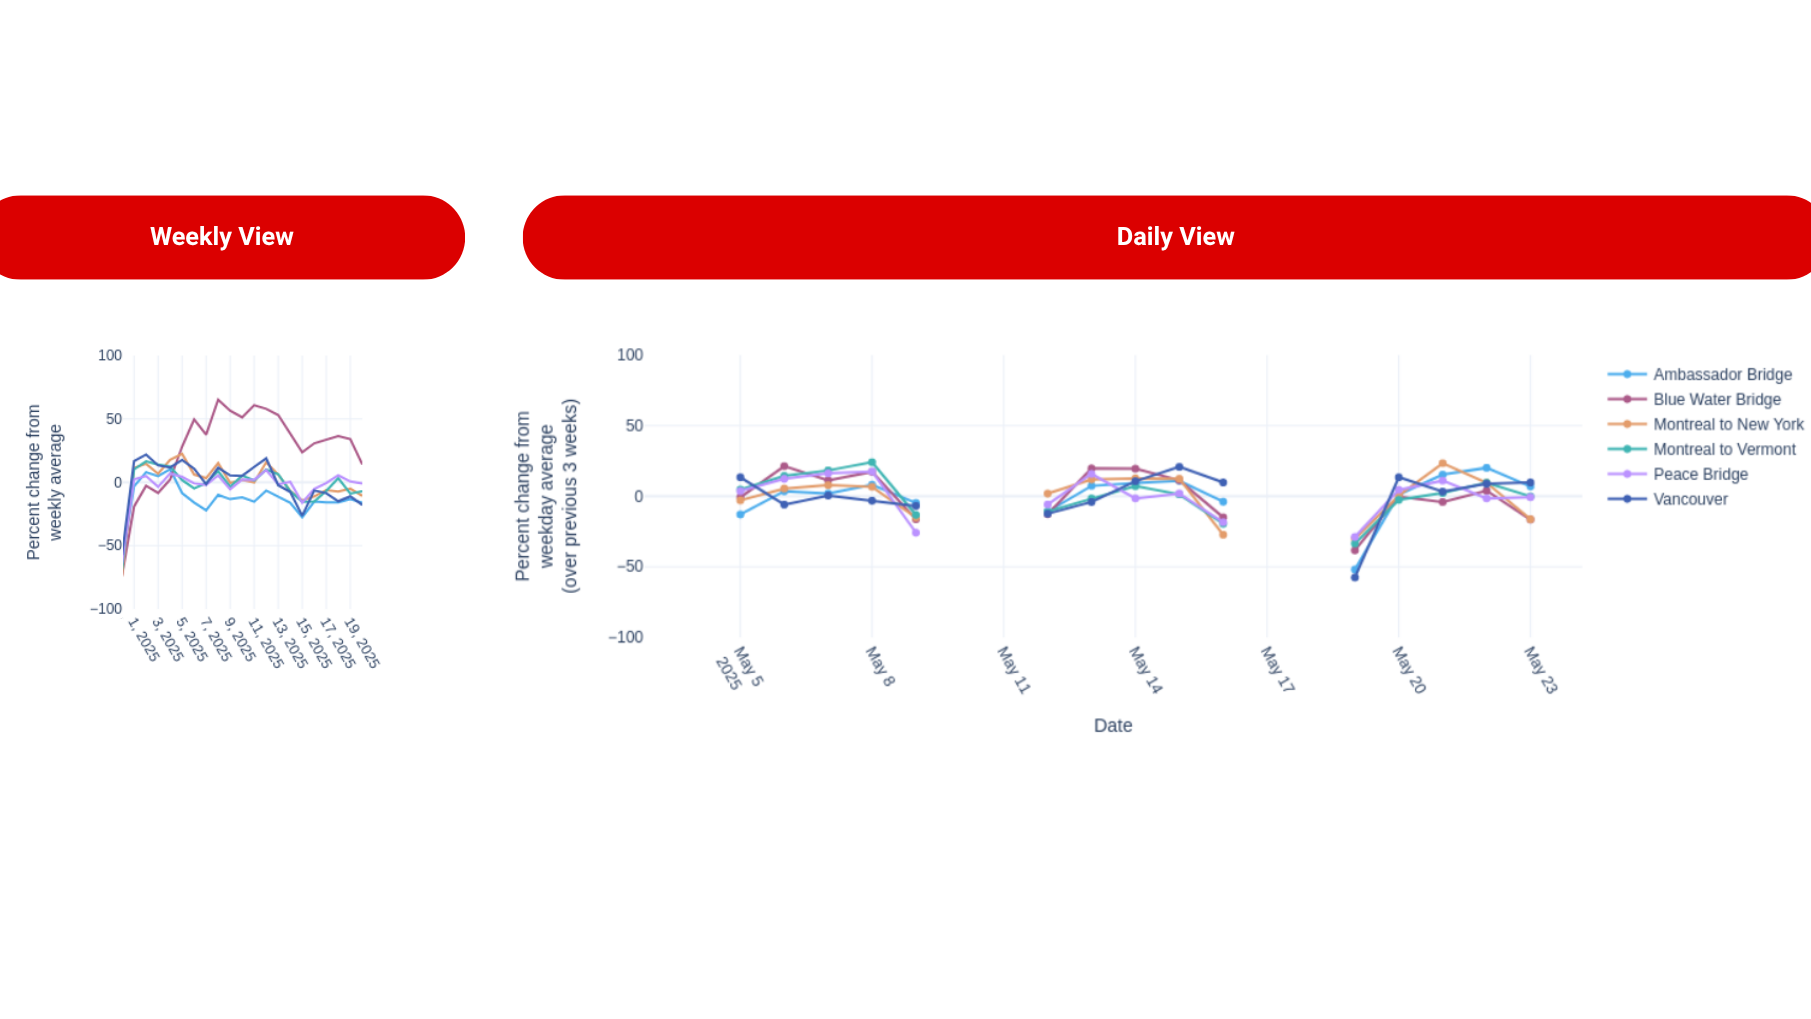
Weekly percent change from avg for HD vehicles by border crossing*:
*The data is ~3 days delayed from real-time, so the weekly plot will be updated on Wednesdays to show data from the preceding week. The weekly plots began the first full week of January, starting January 5, 2025.
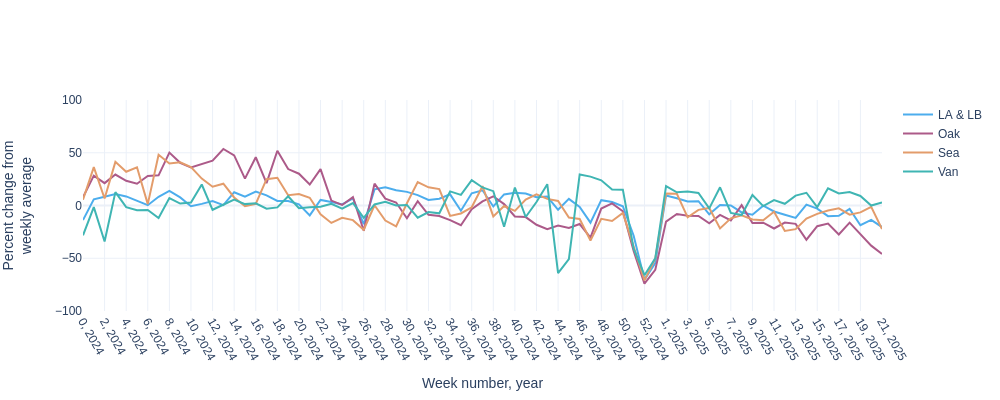
Weekly percent change from average for HD vehicles by port*:
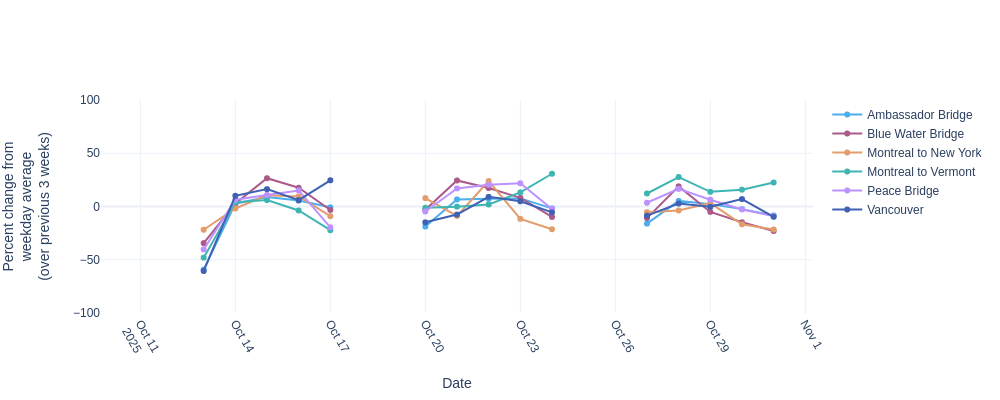
Daily percent change from weekday average for HD vehicles by border crossing*:
*The data is ~3 days delayed from real-time, so the daily plots will be updated daily, but display data from T-3 days before the plot is made.
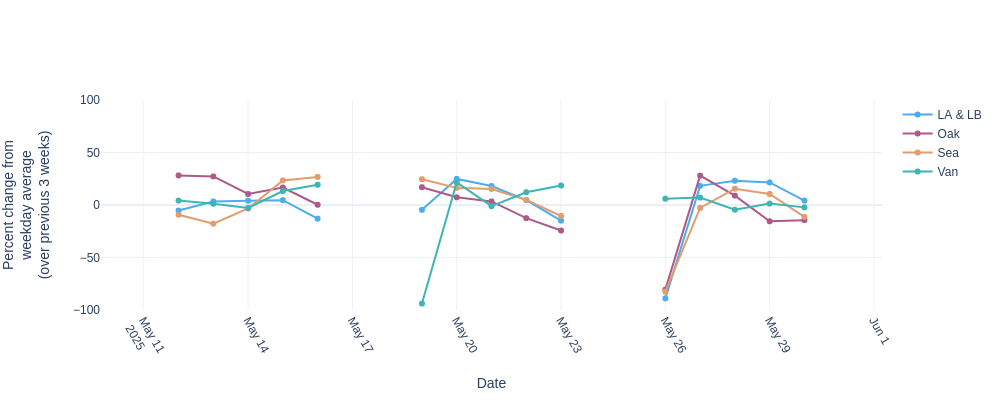
Daily percent change from weekday average for HD vehicles by port*:
Below is a map view of the six major border crossing points between the U.S. and Canada and the four ports we are analyzing:
How Altitude is helping governments and businesses to unlock these insights
To understand these complicated transportation networks across borders and from key ports, there are a number of modules and tools within Altitude available:
Learn more about our Freight Traffic vs. Tariffs Impact - Trend Tracker
Understand the real impact on U.S.-Canada trade and port traffic by studying connected commercial vehicle data. Our trend tracker tool will channel contextualized insights from Altitude, allowing us to keep our finger on the pulse of all cross-border freight and commercial fleet activity from the ports. Both now and into the future, we will be adding greater depth to this story and our tracker’s capabilities, so we encourage you to continue returning to view the impacts of the tariffs.
Update from Nate Veeh – AVP of BD, Altitude by Geotab
Freight shifts post-tariff truce
The global supply chain has been navigating a period of unprecedented turbulence. And just as supply chains and ports began to brace for a new normal, mid-May brought an unexpected development: a sudden 90-day truce between the US and China. This abrupt shift, while offering a potential breather, injects a fresh wave of questions and uncertainty for logistics leaders, compelling them to ask: What does this latest pivot truly mean for the movement of freight on the ground?
In such a fluid environment, concrete data becomes indispensable. The real-world impacts of these high-level decisions can be directly observed through heavy-duty vehicle (HDV) activity. These commercial vehicles are vital for North American trade, and their movement patterns across the critical U.S..-Canada border and through the bustling West Coast ports, including Los Angeles, Long Beach, Oakland, Seattle and Vancouver, serve as excellent barometers. Tracking shifts in volumes and flow provides crucial intelligence on how tariffs may be affecting supply chains. For example, here’s a stripped down view of the Ports of L.A. and Long Beach. As we can see, since the beginning of January, neither has seen a major decrease in incoming or departing freight volumes.
Making sense of freight shifts over time is precisely where Altitude by Geotab steps in. Through our cross-border freight and port activity tracker, we cut through the complexity, offering clear, real-world insights into unfolding trends. By monitoring granular changes in HDV operations at these key trade nexuses, we empower businesses to better anticipate challenges, seize opportunities and navigate geopolitical influences on North American freight movement.
Heavy-duty traffic eases slightly at key U.S.-Canada crossings: No alarm bells yet
Recent observations of heavy-duty vehicle traffic across key US-Canada land borders, such as those connecting Montreal to New York and Vermont, as well as the Vancouver crossing, indicate a slight downturn. When analyzing week-over-week data, a discernible downward shift in commercial vehicle volume is apparent. However, a closer look at daily traffic patterns over the past few weeks reveals a more nuanced picture: Crossings continue to experience both busy and slower days. This fluctuation suggests that while there’s a marginal decrease, these vital trade arteries are far from being abandoned by fleet and freight vehicles.
This trend in freight movement contrasts with the more pronounced and consistent decline observed in passenger vehicle data, a phenomenon highlighted in reports such as the BBC’s “US-Canada border towns hit by Trump’s trade war” article, which detailed the significant impact of trade tensions on cross-border personal vehicle traffic and travel. While that report focused on an earlier period of trade friction, the distinction remains relevant: Passenger traffic appears more susceptible to sustained decreases compared to commercial freight. For supply chain stakeholders, the current subtle dip in heavy-duty traffic is not yet a cause for major alarm. Nevertheless, it’s a development that warrants continued monitoring to understand any emerging patterns or potential impacts on transborder commerce.
It’s also worth noting that, as one might anticipate, our data registered a significant downturn in heavy-duty vehicle movement during the recent Canadian Victoria Day holiday. We fully expect to observe a similar pattern in the forthcoming data for the Memorial Day weekend in the U.S. These holiday-related lulls are important to distinguish, as they aren’t indicative of a tariff-driven trend or a broader sustained decline in freight demand. Rather, these predictable dips serve as a useful confirmation that our data accurately mirrors the real-world operational rhythms and temporary slowdowns characteristic of the market, further grounding our overall analysis of transborder traffic.
Update from Nate Veeh – AVP of BD, Altitude by Geotab
U.S. port freight activity shows notable decline in 2025 amidst trade and tariff uncertainty
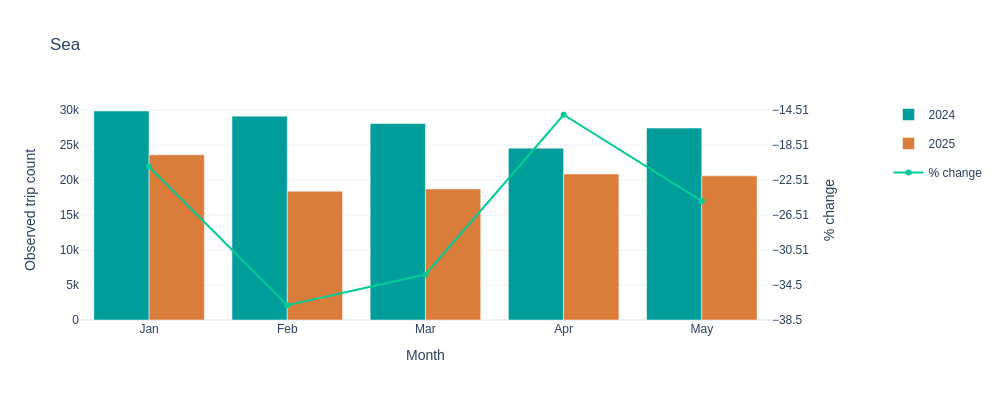
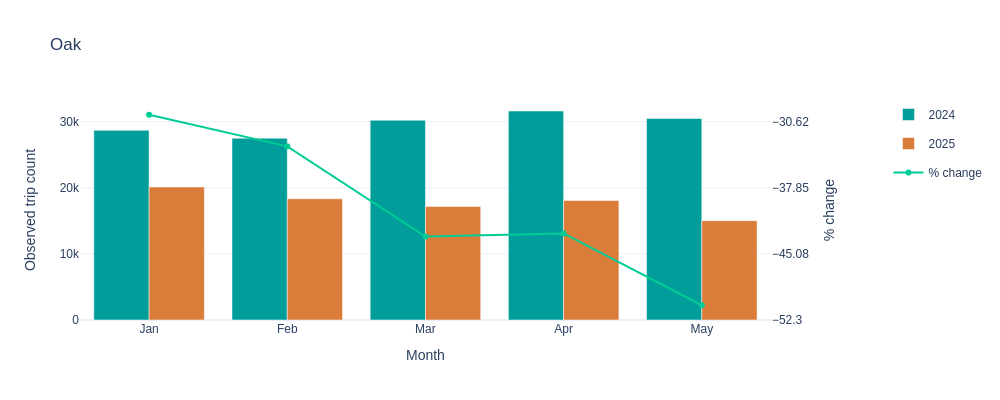
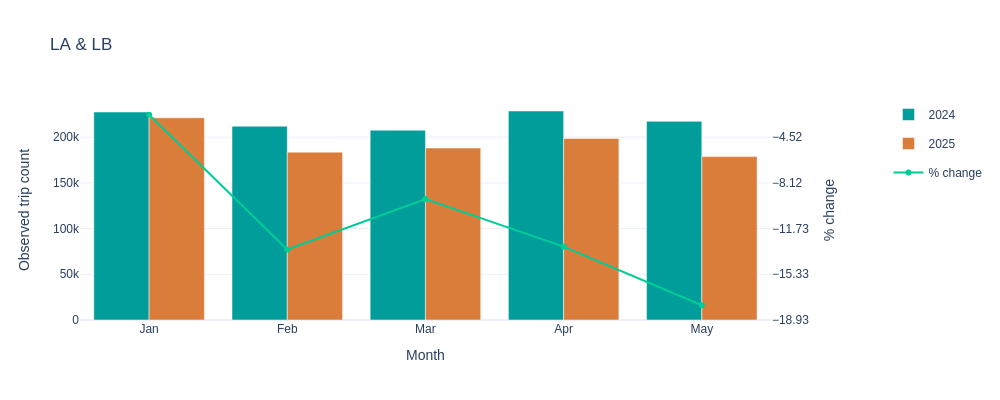
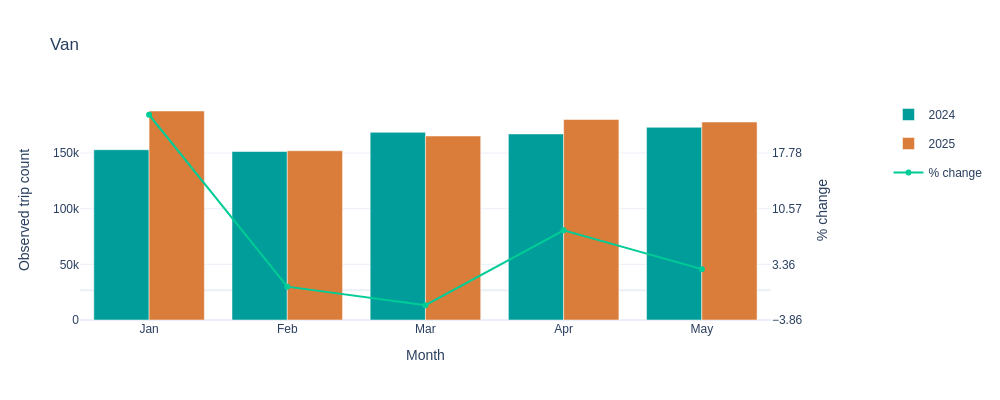
Recent Altitude by Geotab data reveals a general downturn in monthly freight trip counts at western U.S. ports in 2025 compared to 2024, a trend notably contrasted by a slight increase at the Port of Vancouver. Specifically, May 2025 marked a significant dip from April, suggesting a potential impact from tariffs on shipments and supply chain activity. While the Ports of Los Angeles/Long Beach and Oakland have seen consistent declines throughout the year (approximately 10% and 30% respectively from 2024 to 2025), the Port of Seattle, despite more variable activity, also experienced a decline in May 2025, contributing to an overall decrease of about 25% year-over-year.
These trends align with the initiation of trade conflicts with Canada and China in February 2025, and a significant escalation with China in early April. However, it’s worth noting that Seattle and Oakland already showed lower freight trip counts in January 2025 (prior to trade conflicts) compared to 2024, indicating that factors beyond tariffs may also be influencing the overall decline. We will continue to closely monitor these evolving trends and update our tracker with more information as it becomes available.
SUMMARY
Port
Trip count change trend (2024 to 2025)
LA & LB
Decrease ~10%
Oak
Decrease ~30%
Sea
Decrease ~25%
Van
Increase ~5%
TRIP COUNTS
Update from Nate Veeh – AVP of BD, Altitude by Geotab
Navigating the Tides of Trade: Tracking West Coast Port Activity Amidst Ongoing Tariff Uncertainty
The landscape of global trade continues to be shaped by persistent tariff uncertainties in the United States. Businesses worldwide are grappling with the implications of these policies, which include high effective tariff rates and a complex web of new and threatened duties against various nations. The fluidity of these regulations, marked by pending court decisions and announced tariff increases, has injected a degree of caution into international commerce, influencing supply chain strategies and investment decisions.
Against this backdrop of economic shifts, port activity across North America presents a varied picture, particularly in the realm of trucking and cargo movement.
U.S. West Coast Ports: A Mixed Outlook
While the overall trade environment remains uncertain, there are signs of stabilization in trucking activity at the Ports of Los Angeles and Long Beach, as well as the Port of Seattle. These critical gateways, vital for trans-Pacific trade, appear to be finding a more consistent rhythm in their ground transportation operations.
However, this stabilization is not uniform across all major U.S. West Coast ports. The Port of Oakland has experienced the most significant decrease in trucking activity. Recent data indicates a notable decline in its June 2025 container volume compared to the same period last year, reflecting a market recalibration by shippers and carriers in response to evolving demand and the ongoing tariff climate.
Canada’s Port of Vancouver: A Different Trajectory
In contrast to some of its American counterparts, the Port of Vancouver, the sole Canadian port included in this analysis, has demonstrated a distinct trend of similar and increased trucking activity this year compared to last year. The port has reported a robust recovery in container traffic and overall cargo volumes. For instance, in 2025, its container terminals saw an 11% increase in activity compared to 2024, with both inbound and outbound container volumes growing significantly. This indicates a resilient performance, potentially benefiting from shifts in trade routes and a strong appetite for certain imports.
The diverse performance of these major ports underscores the dynamic nature of supply chains in the face of tariff policies and broader economic forces. As businesses continue to navigate these complexities, monitoring port activity provides valuable insights into the pulse of global trade.
TABLE SUMMARY
Port
Trip count change trend (June 2024 to June 2025)
LA & LB
Decrease but may be flattening and/or bouncing back in June
Oak
Significant Decrease
Sea
Decrease until June, then in June we see an Increase
See how freight route planning for weekday events can cut harsh braking risk. Real traffic data from Leo Messi and Cristiano Ronaldo’s June games reveals why.
Toll changes at the US-Canada border shifted truck traffic — and revealed the hidden freight congestion impact on delivery times, penalties and regional economic health.
Our Arizona case study illustrates how to capture true last-mile delivery behavior to inform infrastructure wear and tear, safety, curbside management, and more.