No pit stop required: Special event traffic management planning
When auto racing shut down the Las Vegas Strip, freight kept moving. See how data-backed special event traffic management planning kept the city’s supply chain intact.

Posted: April 2, 2025 at 11:08 AM EST.
Proposed new tariffs on imports to the United States from neighboring countries, Canada and Mexico, have been a hot topic in the news for the past several months. While many reports have cited anecdotal observations of cross-border traffic changes between the U.S. and Canada as a result of the tariff proposals, we used connected commercial vehicle data to quantify this change.
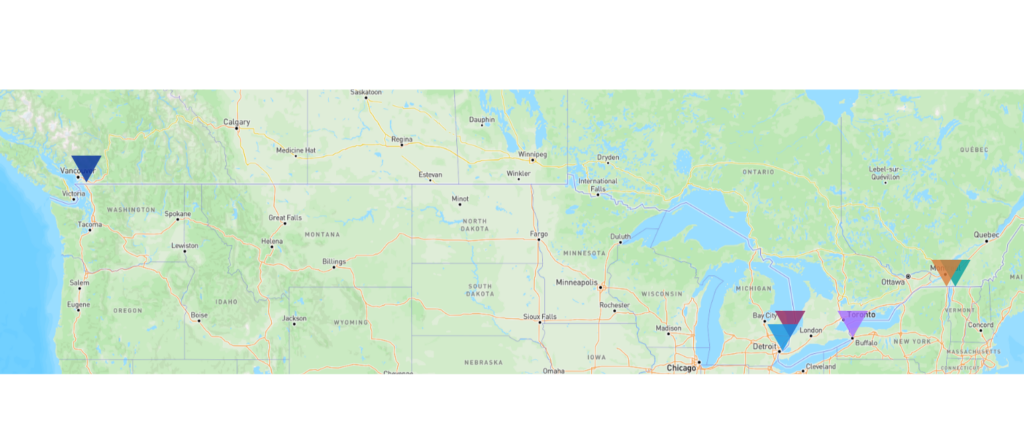
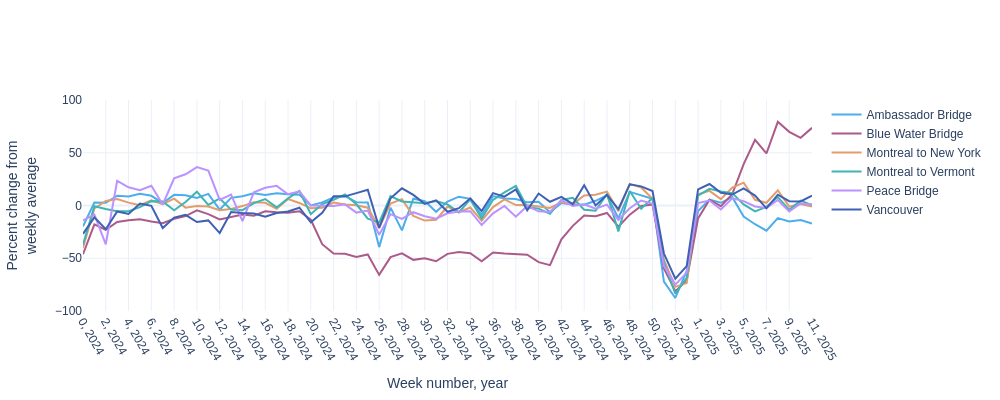
Altitude by Geotab has examined heavy-duty vehicle volumes at six major border crossing points (shown on the map below) between the U.S. and Canada over all of 2024 and the first 10 weeks of 2025. The plot below shows the weekly percent change compared to the overall weekly average from the entire time period. The plot indicates that most of the border crossings remain relatively close to average every week, except during the winter holidays, when cross-border movement drops to roughly 80% below average. The crossing activity at Blue Water Bridge is more volatile because the bridge underwent extensive construction between May and October. This construction caused freight movement on the Blue Water Bridge to drop about 50% below average. Additionally, in the beginning of 2025, the toll on Ambassador Bridge increased, which may have caused a shift in freight volume from Ambassador Bridge to Blue Water Bridge. The percent increase is more noticeable on the Blue Water Bridge because the overall freight volume on Ambassador is two to three times higher.
While public conversation around tariffs has raised concerns about potential disruption to cross-border freight, our data tells a more measured story, for now. Altitude by Geotab’s aggregated insights show that commercial vehicle volumes between the U.S. and Canada have remained largely consistent in early 2025, despite the growing attention. But stability doesn’t mean inactivity. Trade dynamics often shift gradually or in response to specific policy milestones, and we expect that any freight impacts may surface in the future. Even without real-time border wait time data, Altitude provides a reliable, aggregate view of commercial vehicle movement across major crossings, offering a valuable baseline for comparison as the situation evolves. Our team will continue monitoring trends and sharing insights through our tariffs tracker, designed to help infrastructure, safety, and supply chain planners stay informed as real-world impacts take shape.

To help visualize and monitor continued supply chain effects from the tariff proposals, our team is building a custom tracking tool that will be released next week. This tool will channel contextualized insights from Altitude, allowing us to keep our finger on the pulse of all cross-border freight and commercial fleet activity. Both now and into the future, we will be adding greater depth to this story and our tracker’s capabilities, so we encourage you to continue checking it over time once it’s live.
When auto racing shut down the Las Vegas Strip, freight kept moving. See how data-backed special event traffic management planning kept the city’s supply chain intact.
A wake up call for Southern freight planning: Winter Storm Fern cut commercial vehicle movement by 54% in Dallas. See what the data reveals, and what Southern transportation planners must do next.
Learn how freight corridor analysis helps planners identify stressed routes, forecast deterioration, plan detours and build defensible strategies to win funding.