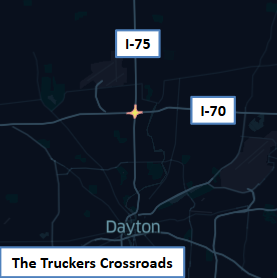
Ohio is a vital artery in North America’s freight network, often called the “Truckers Crossroads” where major interstates I-70 and I-75 intersect. This strategic location is central to the movement of goods across the country, with over one billion tons of goods valued at over $1.2 trillion moving through Ohio annually. The sheer volume of freight highlights the critical role Ohio plays in the national supply chain and the importance of ensuring these routes are efficient and safe for everyone.
At Altitude by Geotab, we believe that understanding these complex transportation networks requires more than just raw data; it requires actionable insights that prioritize the well-being of the people who rely on them. By analyzing anonymized, aggregated data from millions of commercial vehicles, we can provide a clearer picture of mobility trends and challenges. This allows transportation planners and departments to identify problems, prioritize solutions, and monitor the performance of their infrastructure projects.
A Look at the Journey
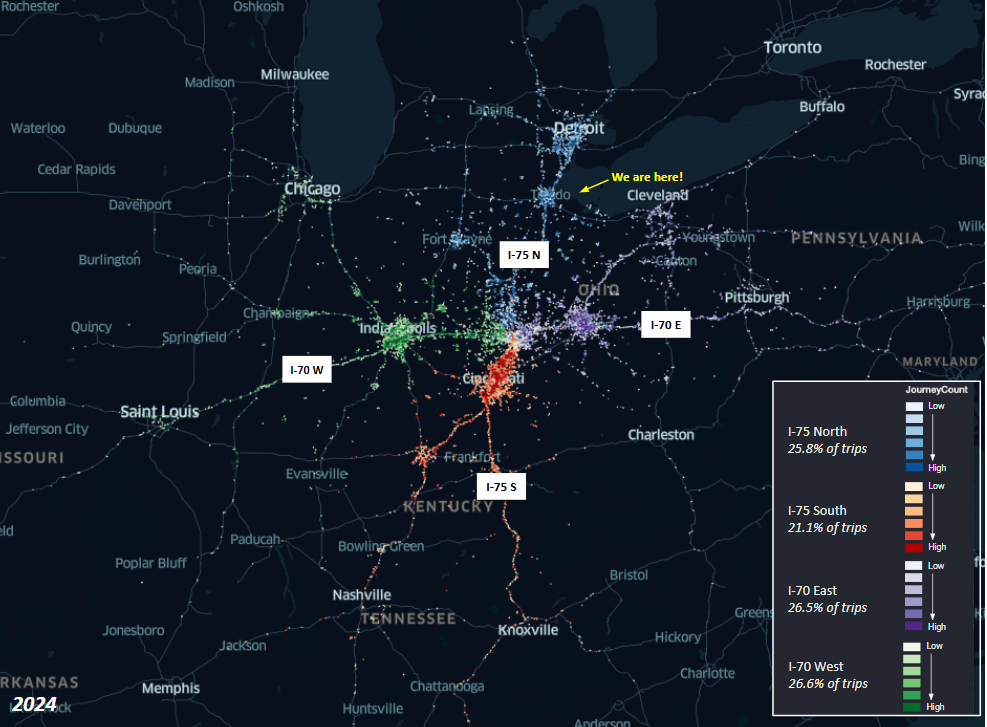
 Trucks passing through the I-70/I-75 Crossroads in Ohio have a wide reach, with destinations in every state in the continental United States. This demonstrates the crossroads’ significance as a national hub for freight movement. In 2024, the average trip for a commercial vehicle through this region was approximately 149 miles and lasted about 3 hours. The majority of these trips — 66% — were made by heavy-duty trucks.
The distribution of traffic is relatively even across the major routes, though I-70 sees slightly more movement. I-70 East and West account for 26.5% and 26.6% of trips, respectively, while I-75 North and South make up 25.8% and 21.1%. These trucks are heading toward key destinations such as Detroit, Chicago, Indianapolis, and Columbus. There is also significant traffic on I-75 heading towards the Canadian border.
Addressing the Challenges of Congestion
While traffic flow is generally consistent, congestion remains a significant challenge, especially during peak hours. In Cincinnati, for example, traffic on I-74/I-75 and I-75/I-275 slows down during peak hours, impacting heavy-duty trucks in particular. Similarly, on the I-70/I-71 interchange in Columbus, traffic also slows during peak hours.
The human impact of congestion cannot be overstated. According to the American Transportation Research Institute, traffic congestion cost the U.S. trucking industry an estimated $108.8 billion in 2022. This is more than just a number; it represents lost productivity equivalent to over 430,000 commercial truck drivers sitting idle for an entire year. These delays can lead to increased operating costs and disruptions to the supply chain, which can ultimately affect consumers.
The Critical Need for Truck Parking
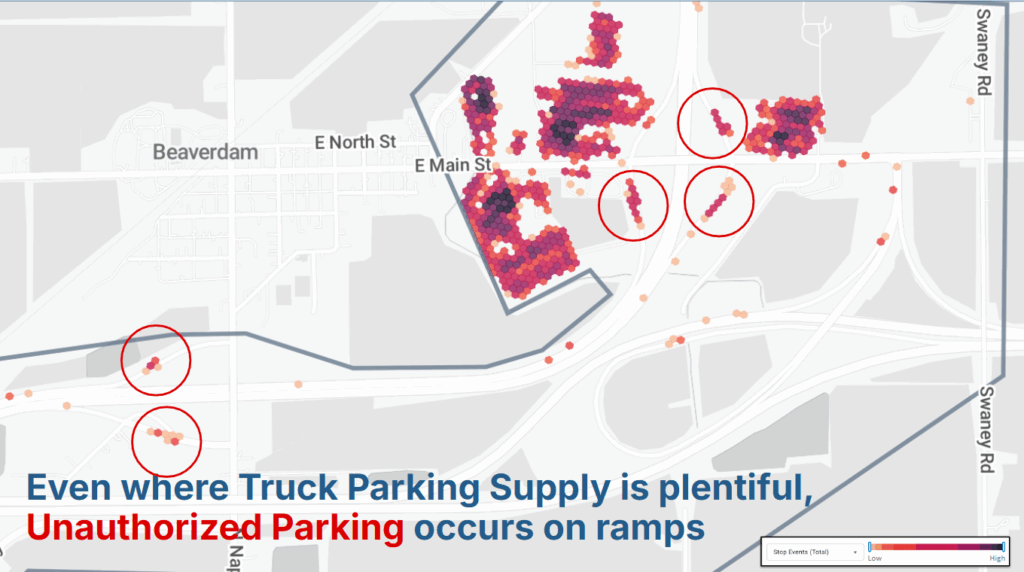
Another major challenge facing drivers is the demand for safe and accessible truck parking. An insufficient supply of safe parking forces tired drivers to continue driving or to park in unsafe, undesignated locations. Altitude data shows where “stop events” — vehicles stopping for more than one hour — are concentrated along the I-70/I-75 corridor.
Even when authorized parking is available, unauthorized parking can still occur on nearby on-ramps and off-ramps. For instance, at a rest stop in Hancock County, 11% of stops were unauthorized. These unauthorized stops, often by heavy-duty, long-distance transportation and warehousing vehicles, tended to be longer, with a median duration of 60-80 minutes compared to about 50 minutes for authorized stops.
The consequences of this parking shortage are severe. From 2015 to 2019, Ohio experienced 106 crashes involving trucks parked in undesignated locations, resulting in 52 fatalities and injuries. Furthermore, over 460 fatigue-related crashes occurred during this same period where truck drivers were at fault, underscoring the direct link between parking availability and driver fatigue.
Learning from the Unexpected: The Brent Spence Bridge Case Study
While a fire on the Brent Spence Bridge in 2020 created a major disruption, it also offered a valuable lesson in crisis management. The closure of this critical route on Interstates 71 and 75 highlighted the importance of understanding real-world traffic patterns to inform emergency response and infrastructure planning.
Altitude by Geotab helps transportation planners prepare for the unexpected by providing the insights needed to make informed decisions. By analyzing historical, aggregated mobility data, planners can simulate the effects of a disruption before it even happens. Our data revealed that during the Brent Spence Bridge closure, traffic volume on neighboring bridges and local roads surged unexpectedly. The nearest bridge saw a 318% increase in volume, and heavy-duty truck traffic on a local street rose by 23%. This led to a doubling of travel times for city commuters. While alternative interstate routes were available, many drivers chose local roads, which brought city traffic to a halt.
The Altitude platform provides a way to understand how traffic truly behaves during a major event. This level of insight allows transportation stakeholders to:
- Identify vulnerabilities: Pinpoint areas and routes that are most susceptible to traffic surges during a disruption.
- Develop effective rerouting strategies: Create and communicate alternative routes that commercial drivers are more likely to follow, preventing local gridlock.
- Prioritize infrastructure investments: Use data-driven insights to reinforce key infrastructure and build redundancy into the transportation network.
By using the Altitude platform, planners can move from reactive to proactive, turning historical data into a powerful tool for anticipating future challenges and ensuring the safety and efficiency of the transportation network for everyone.