By Nate Veeh, AVP- Business Development – Altitude by Geotab
For rental vehicle businesses and vacation hotspots, staying ahead means understanding where demand truly lies; not just today, but where it’s headed tomorrow. Leveraging advanced analytics, like those offered by Altitude by Geotab, you can gain an unparalleled view into vehicle usage patterns, helping identify both established rental hubs and crucial indicators for emerging markets and travel hotspots.
We took a look into our insights with Altitude’s Stop Analytics module. Stopping behaviors are a critical indicator of vehicle activity that, for a rental fleet, translates directly to customer usage, popular destinations and operational efficiency. Let’s see what our aggregated connected vehicle data reveals about key rental landscapes.
Current rental powerhouses: Insights from rental vehicle stop insights
The sheer volume of “stop events” pinpoints where vehicles are highly active, and by extension, where rental demand is likely strongest.
- Los Angeles County, California: With a staggering 1,102,109 stop events, L.A. County is undeniably a massive market for rental vehicles. The median stop duration of 15 minutes and 37 seconds and low idle times suggest a dynamic environment with frequent, purposeful usage: Ideal for short-term rentals, ride-sharing and rapid urban mobility.
- Orange County, Florida: Registering 657,089 stop events, Orange County also presents a robust rental market. What’s particularly interesting here is the median stop duration of 29 minutes and 37 seconds. This longer stop time could indicate a different type of rental use, perhaps for business purposes requiring extended on-site presence, longer leisure trips or even light commercial rentals.
- Clark County, Nevada (Las Vegas area): A prime tourism destination, Clark County saw 473,818 stop events. The consistent median stop duration of 18 minutes and 11 seconds and median trip distances around 2.57 miles reflect heavy usage often associated with visitors navigating the city.
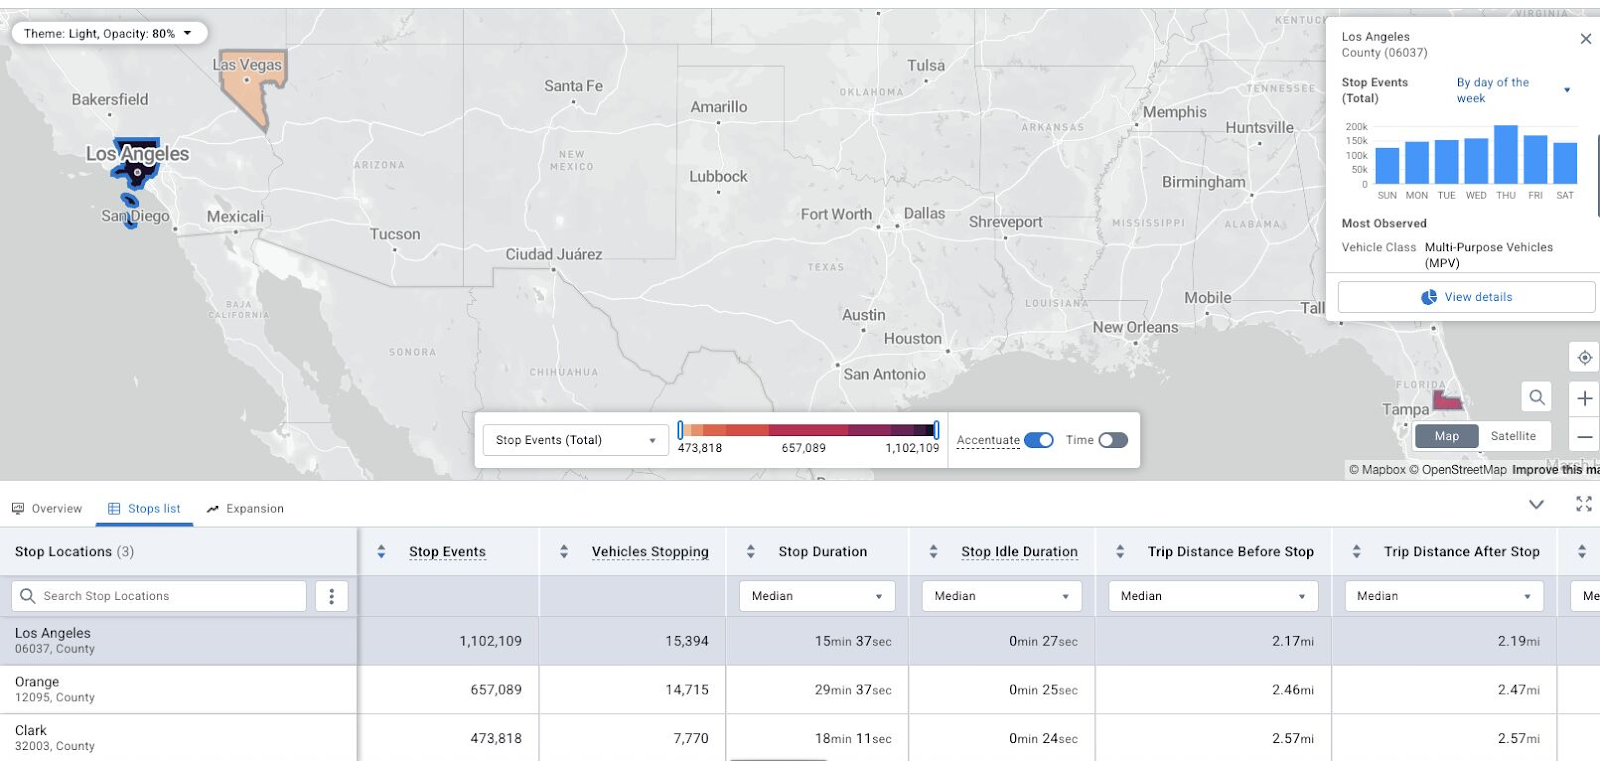
This is what we’ve seen from our data pool in our Altitude platform from May 1, 2025 to May 31, 2025. Our commercial vehicle stop insights revealed that out of all three locations we studied, Los Angeles had the most overall stop event activity; however, stop durations were observed to be the longest in Orange County, Florida (on average).
Identifying where rental markets are headed: The Altitude advantage
While this specific snapshot highlights established travel hotspots, the true power of Altitude by Geotab for rental companies lies in its ability to dive deeper and help them identify upcoming opportunities. This is done by analyzing the characteristics of these high-volume areas and applying that learning to other regions.
- Beyond the top three: Altitude allows you to analyze commercial vehicle activity across all regions, not just those with the highest volumes. By looking at areas with growing stop event numbers, increasing trip distances or shifts in stop durations, rental companies can pinpoint regions experiencing rising demand, perhaps due to factors like these listed below.
- New commercial developments: A surge in business stops could signal demand for corporate or long-term rentals.
- Expanding tourist attractions: Growing activity around specific points of interest can indicate emerging leisure rental hotspots.
- Population shifts: New residential developments might create demand for temporary vehicle solutions.
- The rise of the multi-purpose vehicle (MPV) in rental fleets: Our data indicated that MPVs are the most observed vehicle class in stop events. For rental companies, this is a clear signal: Demand for versatile vehicles suitable for families, groups or those needing extra cargo space is strong. Identifying trends like these through Altitude can help guide smarter fleet purchasing and marketing strategies to meet evolving customer needs.
- Optimizing fleet placement with usage patterns: The detailed day-of-the-week patterns available in Altitude show consistent weekday activity with weekend dips. Rental businesses can leverage this context to support strategies like these.
- Dynamic pricing, where rates are adjusted based on predicted demand peaks and valleys
- Fleet redistribution, which is the practice of strategically moving vehicles between locations to maximize utilization, keeping popular MPVs or sedans available where and when customers need them most
- Forecasting seasonal or event-driven demand surges for specific vehicle types in distinct areas
Drive smarter, grow faster with Altitude
For rental vehicle operations, knowing exactly where vehicles are being used, how they’re being used and where future demand will emerge is crucial. Altitude by Geotab empowers you with the granular, actionable insights needed to:
- Optimize fleet distribution to align with actual usage patterns
- Identify underserved markets ripe for expansion
- Tailor vehicle offerings to specific regional demands
- Enhance customer experience by making sure vehicles are available
- Increase revenue through data-driven, strategic decisions
Ready to pinpoint your next growth opportunity with the power of transportation insights? Explore how Altitude by Geotab can help you stay ahead of commercial vehicle rental market trends and identify untapped revenue potential. Contact us today to learn more about our aggregated mobility data.
Frequently Asked Questions
What other types of businesses can benefit from aggregated mobility data?
Organizations in petroleum and gas, warehousing, utilities services and infrastructure, real estate, and transportation maintenance and repair can drive value by using mobility insights to make well-researched business decisions.
What are commercial vehicle stop insights?
Commercial vehicle stop insights highlight where commercial vehicles are temporarily residing while en route to a destination. Details these insights can provide include stop durations, the number of total stop events and where they’re happening most frequently. You can also distinguish between stop and idle events and analyze average travel distances before and after stops.