Skip to Main Content

Holiday shopping - is it really busier than other times of year?

We take a look at cities around the country to understand where holiday shopping is a big deal and where it’s just business as usual according to commercial vehicle insights

The winter holidays are a busy time of year for ordinary folks and commercial vehicle drivers. While truckers move freight and delivery drivers drop off goods throughout the year, the winter holidays bring an added layer of anticipation from folks who are awaiting packages and store managers navigating their customers’ needs. With this context in mind, we wanted to know – are the winter holidays the busiest season for commercial vehicles? We analyze telematics data from 8 American cities and hundreds of thousands of vehicles to answer these questions.

Big box and online retail

From a commercial vehicle perspective, both online and big box retail drive activity. However, the nature of that activity may differ. For example, door-to-door deliveries typically increase with online retail compared to big box. The popularity of one type of retail over another is continually evolving.The COVID-19 pandemic caused a surge in online retail activity because physical stores closed and consumers shifted their spending accordingly. Following the peak pandemic period, the volume of online purchases dropped as shoppers returned to pre-pandemic behavioral norms and rediscovered the convenience of physical stores. However, recent findings from the US census bureau indicate that online retail activity is currently similar to what it was in 2020. Because of this, we investigated commercial vehicle trips that are associated with big box stores as well as those associated with online retail.

Retail activity around the US

We analyzed commercial vehicle activity data from freight trucks, delivery vans, and other commercial vehicles in 8 different American cities over 2024. Many cities have similar patterns to each other, with a few notable exceptions that we’ll address below. Furthermore, about half (5) of the cities that we looked at have notable winter holiday peaks while the other 3 do not. The map below shows which 8 cities we assessed (Atlanta, Charlotte, Chicago, Denver, Houston, Los Angeles, New York, and Salt Lake City) as well as which cities have holiday peaks (Charlotte, Chicago, Los Angeles, New York, Salt Lake City) and which do not (Atlanta, Denver, Houston).

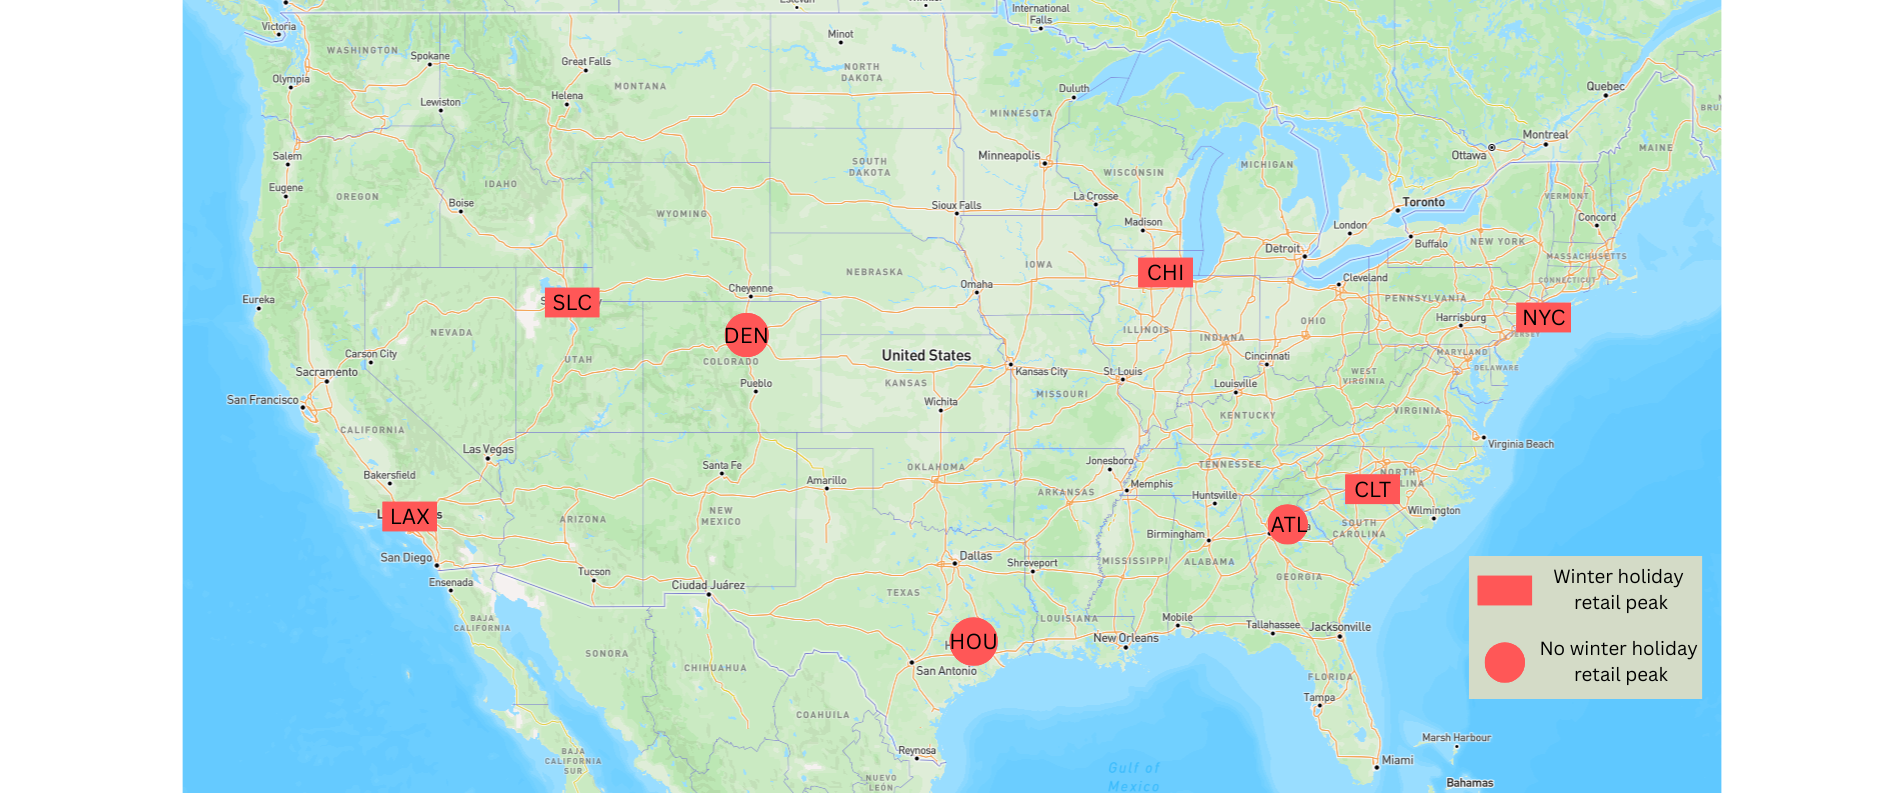
The map shows which 8 cities were assessed in this study (Atlanta, Charlotte, Chicago, Denver, Houston, Los Angeles, New York, and Salt Lake City) as well as which cities have holiday peaks (Charlotte, Chicago, Los Angeles, New York, Salt Lake City) and which do not (Atlanta, Denver, Houston).


Interestingly, outside of  the winter holidays, many of the cities have similar peak periods for both online and big box retail which tend to fall between May and August. Salt Lake City and Denver are the exceptions to this pattern. Salt Lake City has a big box retail peak in August and September and an online peak in September and October. Meanwhile, Denver has an online peak between January and March. The activity in Salt Lake City and Denver may be attributable to winter ski seasons which are popular in both locations. The big box retail peak periods in August in some cities may be partially attributable to college students, who are a particularly large part of the population in Salt Lake City and Atlanta.

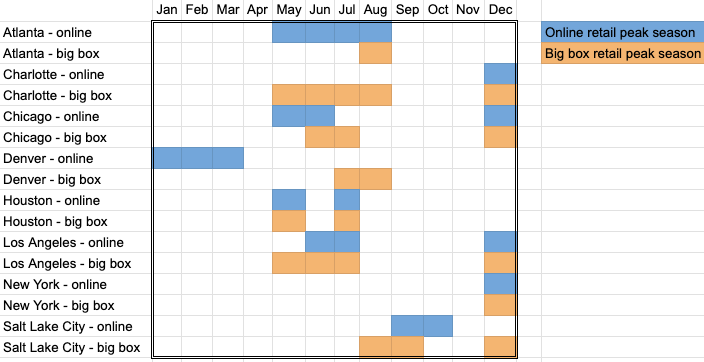
The plot shows when online and big box retail peak periods occurred by month in 2024 in each of the 8 cities that were assessed.


Leveraging Transportation Insights to Uncover Seasonal Commerce Trends

Online and big box retail activity varies temporally and geographically around the United States. In some cities, the winter holidays really are one of the busiest times of year. In other cities, while the holidays might feel like a busy time, they’re not the busiest season overall.  Altitude’s upcoming places of interest data allows for deep dive investigations like this to understand not just how commercial vehicles operate but what types of commerce they’re associated with.

For those interested in conducting their own analysis on their city, region, or state, should check out Altitude by Geotab’s Stop Analytics module, which can be used alongside custom zones to compare vehicle volumes between different user-defined locations. For questions that could be answered using aggregated freight data, please reach out to us directly.

Recent news & releases