On Monday, September 15, 2025, Nashville International Airport (BNA) experienced what officials described as an “unprecedented” traffic crisis. Over 14,000 vehicles moved through the Ground Transportation Center—more than double the typical 6,000 vehicles seen on a Monday¹. The resulting gridlock stranded travelers for hours, with some abandoning their rides on Interstate 40 ramps to make their flights on foot¹.
At Altitude by Geotab, we analyzed this event to understand what happens when multiple demand factors converge on a transportation system that wasn’t designed for such extreme scenarios. Our findings reveal important lessons about airport ground transportation resilience and the cascading effects of demand surges on urban mobility.
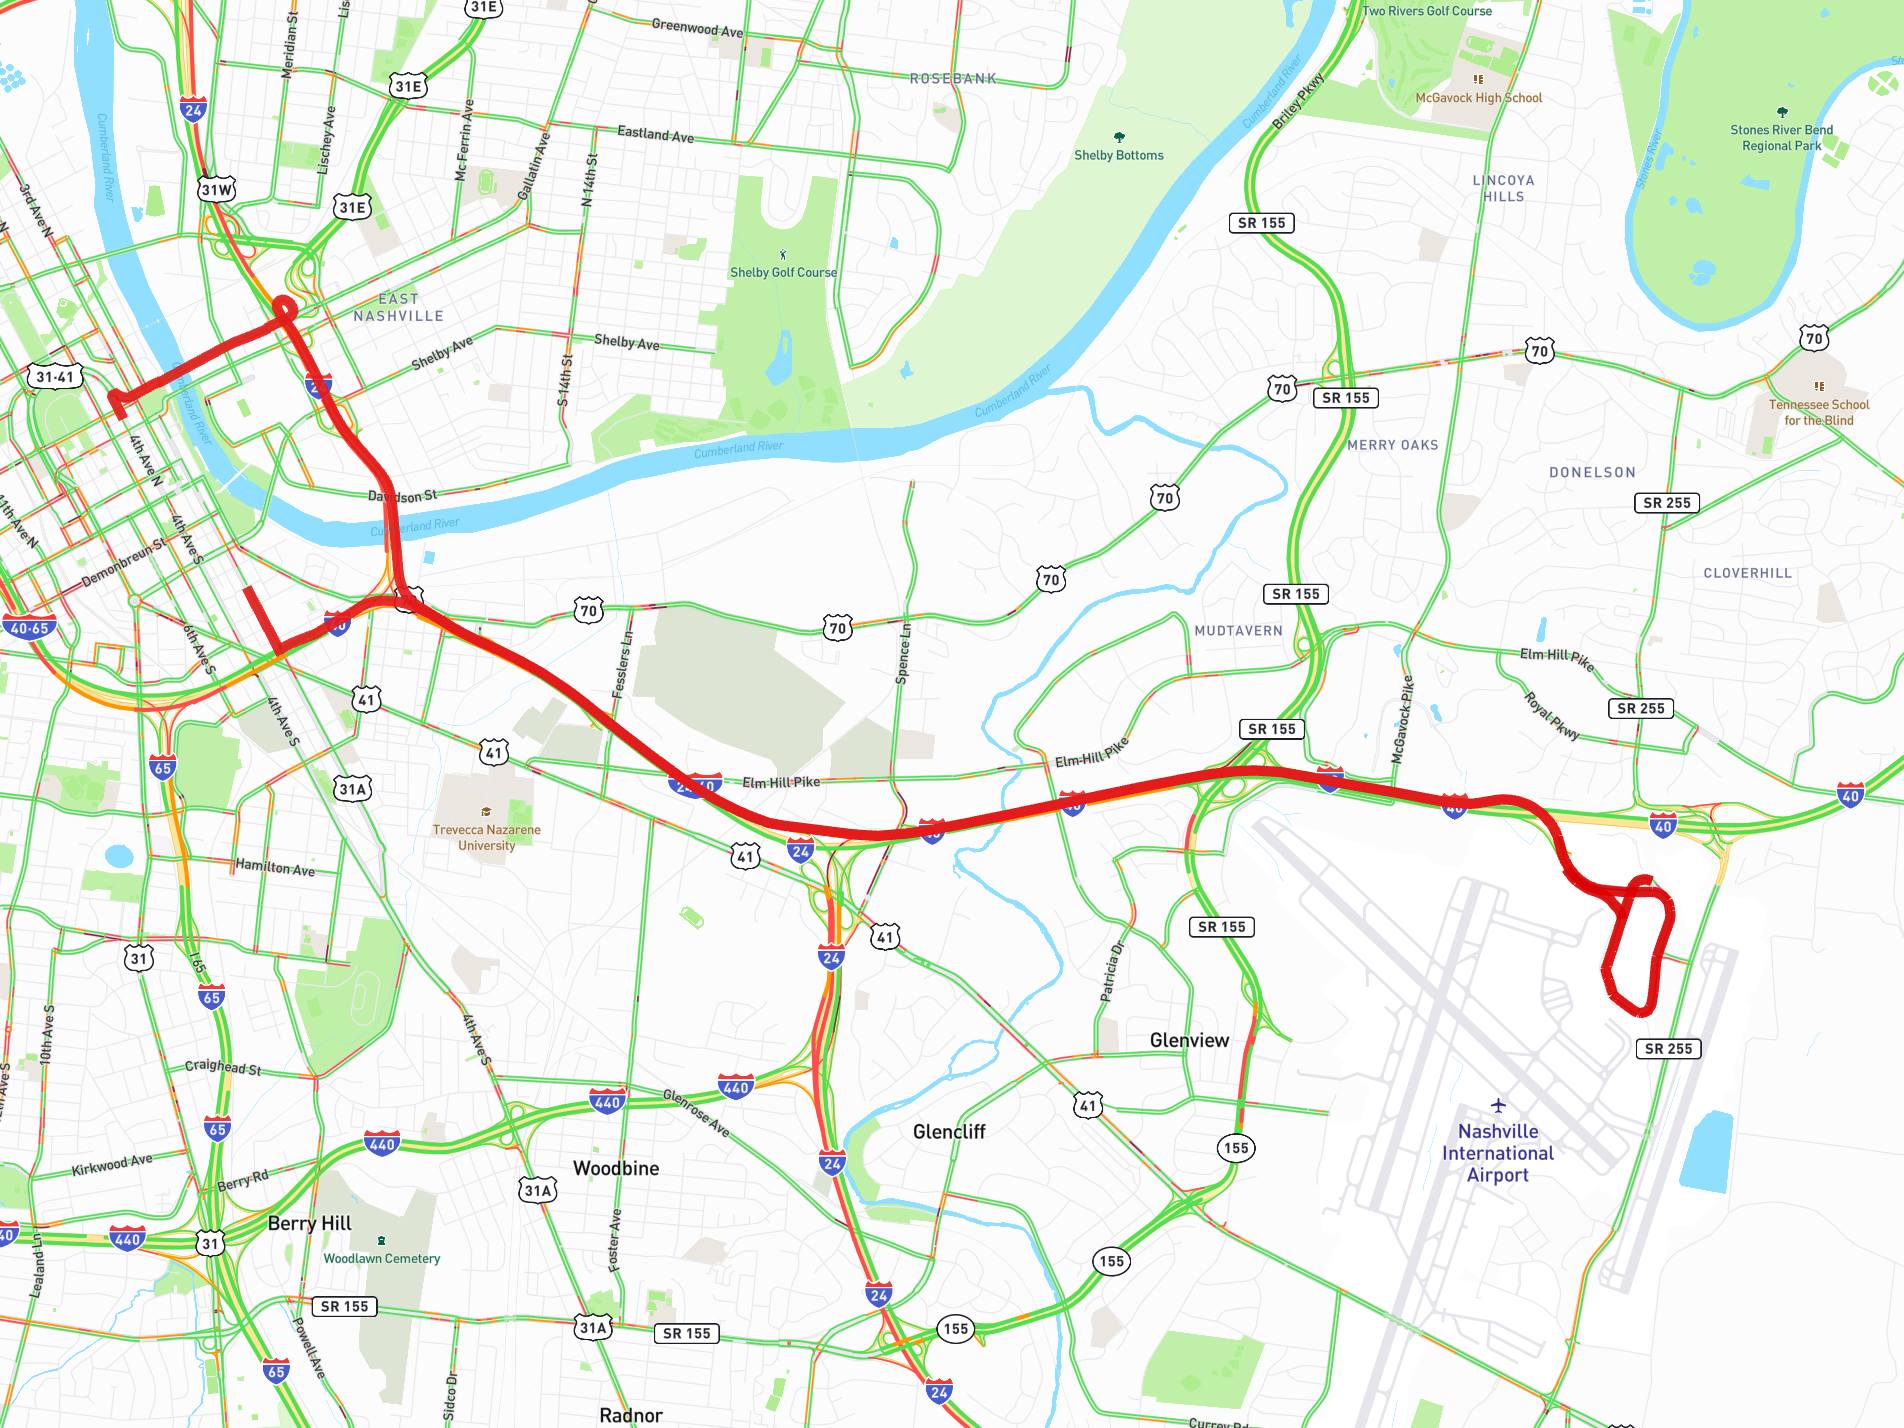 The map above shows the two most common routes taken between downtown Nashville and BNA which are about 6 miles apart. The loop at the airport is Terminal Drive on which traffic speeds were severely diminished as a result of high volume on Monday, September 15.
The Monday Phenomenon: Nashville’s Unique Travel Pattern
While summer travel through airports in the United States is typically concentrated on Thursdays, Fridays, and Sundays, Nashville’s airport actually sees high demand on Mondays. This pattern reflects Nashville’s position as a major business and convention destination, where corporate travelers and event attendees often arrive at the start of the work week.
However, September 15 wasn’t just any Monday. BNA identified a perfect storm of concurrent events that pushed demand far beyond normal parameters:
- NFL fan departures following weekend games¹
- Convention arrivals: The Autodesk Convention brought approximately 10,000 attendees, with an estimated 50% arriving by air¹
- Conference departures: The Society of Corporate Compliance & Ethics conference concluded with 2,200 attendees, approximately 60% departing by air¹
- Rideshare demand surge: Activity reached 2.5 times greater than normal levels, sustained over 11 hours¹
The Data Behind the Gridlock
Our analysis shows that higher-than-normal demand led to slower-than-normal moving speeds throughout the entire ground transportation system. The ripple effects were measurable and severe:
Volume Impact: The Ground Transportation Center, designed to handle 6,000 vehicles on a typical Monday, processed over 14,000 vehicles—a 133% increase that overwhelmed existing infrastructure capacity¹.
Speed Degradation: Traffic speeds dropped significantly not just at the airport itself, but throughout the entire approach corridor, including Interstate 40 ramps and Terminal Drive. The congestion created a feedback loop where slower exit speeds reduced the system’s ability to process incoming vehicles.
Recovery Time: Perhaps most significantly, these slow speeds took more than 12 hours to fully resolve. Even after peak demand periods passed, the transportation network struggled to return to normal flow patterns, demonstrating how demand surges can have persistent effects on system performance.
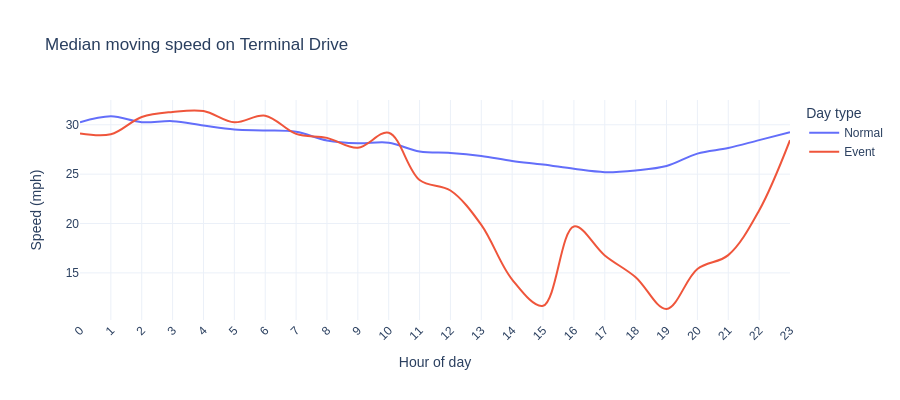
The plot above shows median moving speed on Terminal Drive (the main road through BNA) throughout the day on normal days compared to Monday, September 15, 2025.
The Rideshare Factor
One of the most striking elements of this crisis was the role of rideshare services. With demand 2.5 times normal levels, the traditional pickup and drop-off areas became severely bottlenecked¹. Travelers reported rideshare fares surging from around $40 to more than $200 as drivers faced hours-long delays just to access the airport¹.
This highlights a critical vulnerability in modern airport ground transportation: the concentration of rideshare activity in designated areas creates single points of failure that can cascade throughout the entire system when overwhelmed.
Lessons for Transportation Planning
The Nashville airport incident offers several key insights for transportation planners and airport operators:
Demand Forecasting: Traditional day-of-week patterns may not account for the compounding effects of multiple large events. Better coordination between airports, convention centers, and event organizers could improve demand predictions.
System Resilience: Transportation networks need built-in capacity for surge events, not just average demand. The 12+ hour recovery time suggests that systems operating near capacity have little resilience when faced with unexpected spikes.
Real-Time Response: Dynamic traffic management systems that can quickly adapt routing and capacity allocation during surge events could help prevent minor incidents from becoming major crises.
The Path Forward
The Metropolitan Nashville Airport Authority has initiated a comprehensive after-action review, with plans to strengthen response protocols, expand capacity, and improve coordination with transportation partners¹. These efforts represent exactly the kind of data-driven approach needed to build more resilient transportation systems.
At Altitude by Geotab, we believe that understanding these transportation challenges through data analysis is crucial for building smarter, more adaptive urban mobility systems. The Nashville incident serves as a valuable case study in how multiple demand factors can interact to overwhelm even well-designed transportation infrastructure.
As cities and airports continue to grow, incidents like this underscore the importance of using advanced analytics and real-time data to anticipate, prepare for, and respond to transportation challenges before they become transportation crises.
Want to learn more about how Geotab’s transportation analytics can help your organization better understand and manage traffic patterns? Visit our solutions page to explore our comprehensive mobility intelligence platform.
References:
¹ FOX 17 News. “What caused the over 14,000-vehicle jam at Nashville airport, according to MNAA.” September 16, 2025. https://fox17.com/news/local/what-caused-the-over-14000-vehicle-jam-at-nashville-airport-according-to-mnaa-bna-traffic-nashville-news-local-google-trends