Regional Travel Metrics
Ranks metro and corridor markets by commercial-vehicle demand so you know which region will turn capital fastest and where to place the next build.
Altitude segments total traffic by vehicle class, fuel type, and trip purpose—so developers and fuel retailers see true demand, peak dwell, and growth corridors before committing capital.
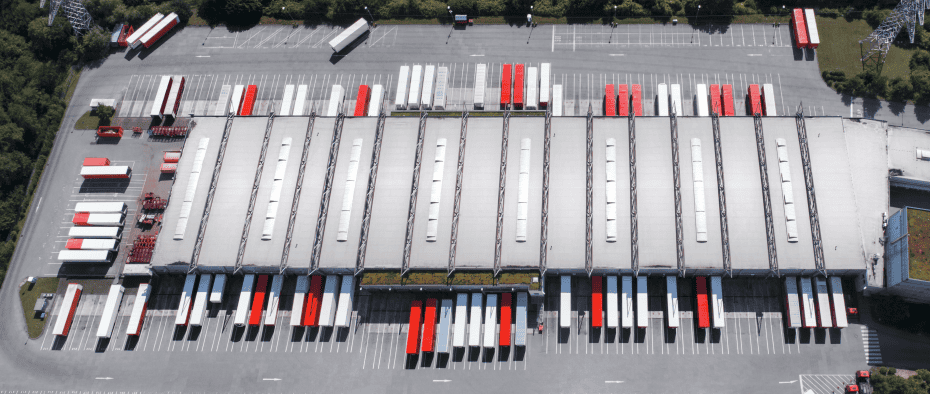
Choosing the wrong parcel locks in years of under-performance. Altitude maps where commercial vehicles actually drive, stop, and spend. Filter by class and trip purpose to surface corridors with the greatest fuel and service demand—so you invest where revenue is proven, not where car counts look large.

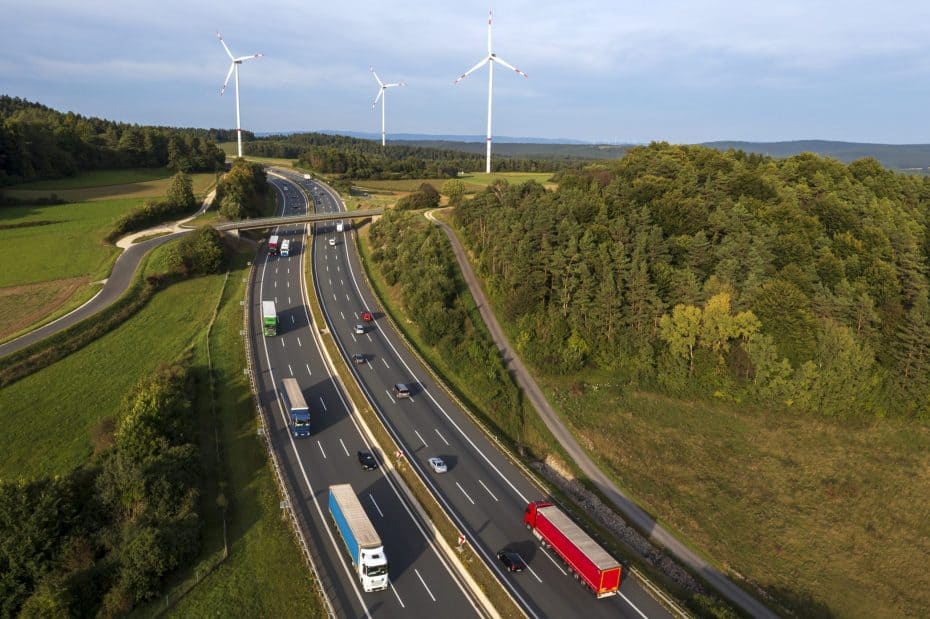
Target parcels with the highest flow of delivery vans, box trucks, tractors and commuter traffic, using class mix, dwell patterns and industry tags to size freight throughput, customer visits, and vehicle access.
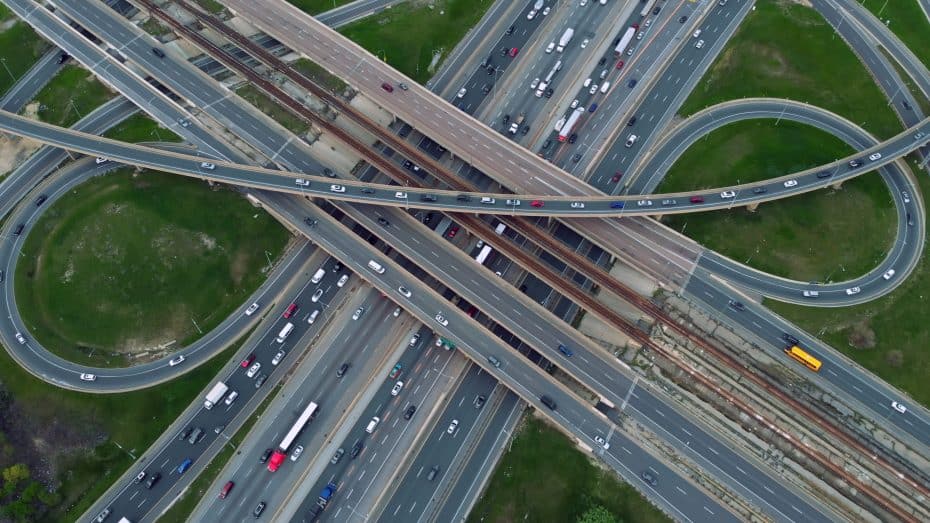
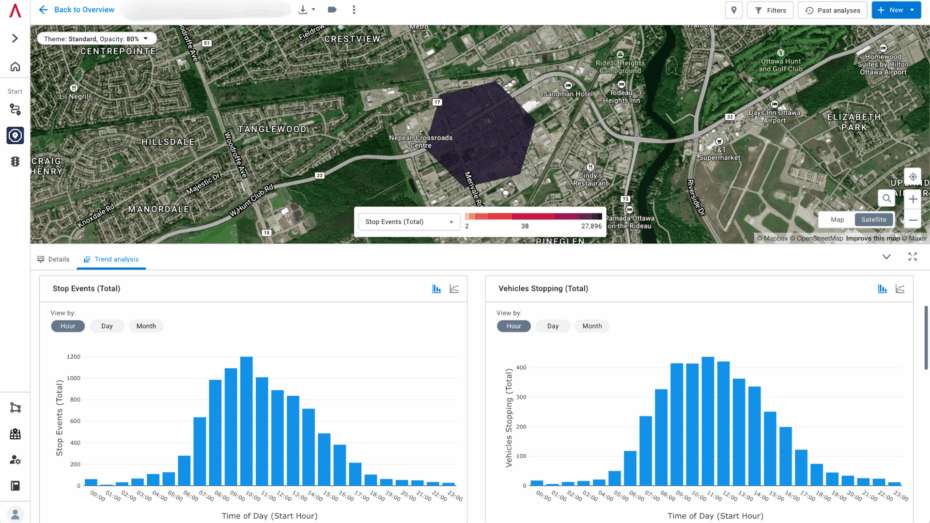
Heat maps reveal interchanges where commercial-vehicle turn-in rates spike and competitors are thin.
Right-size CapEx by comparing weekday vs. weekend traffic and identifying seasonal peak stop locations based on travel time and distance.
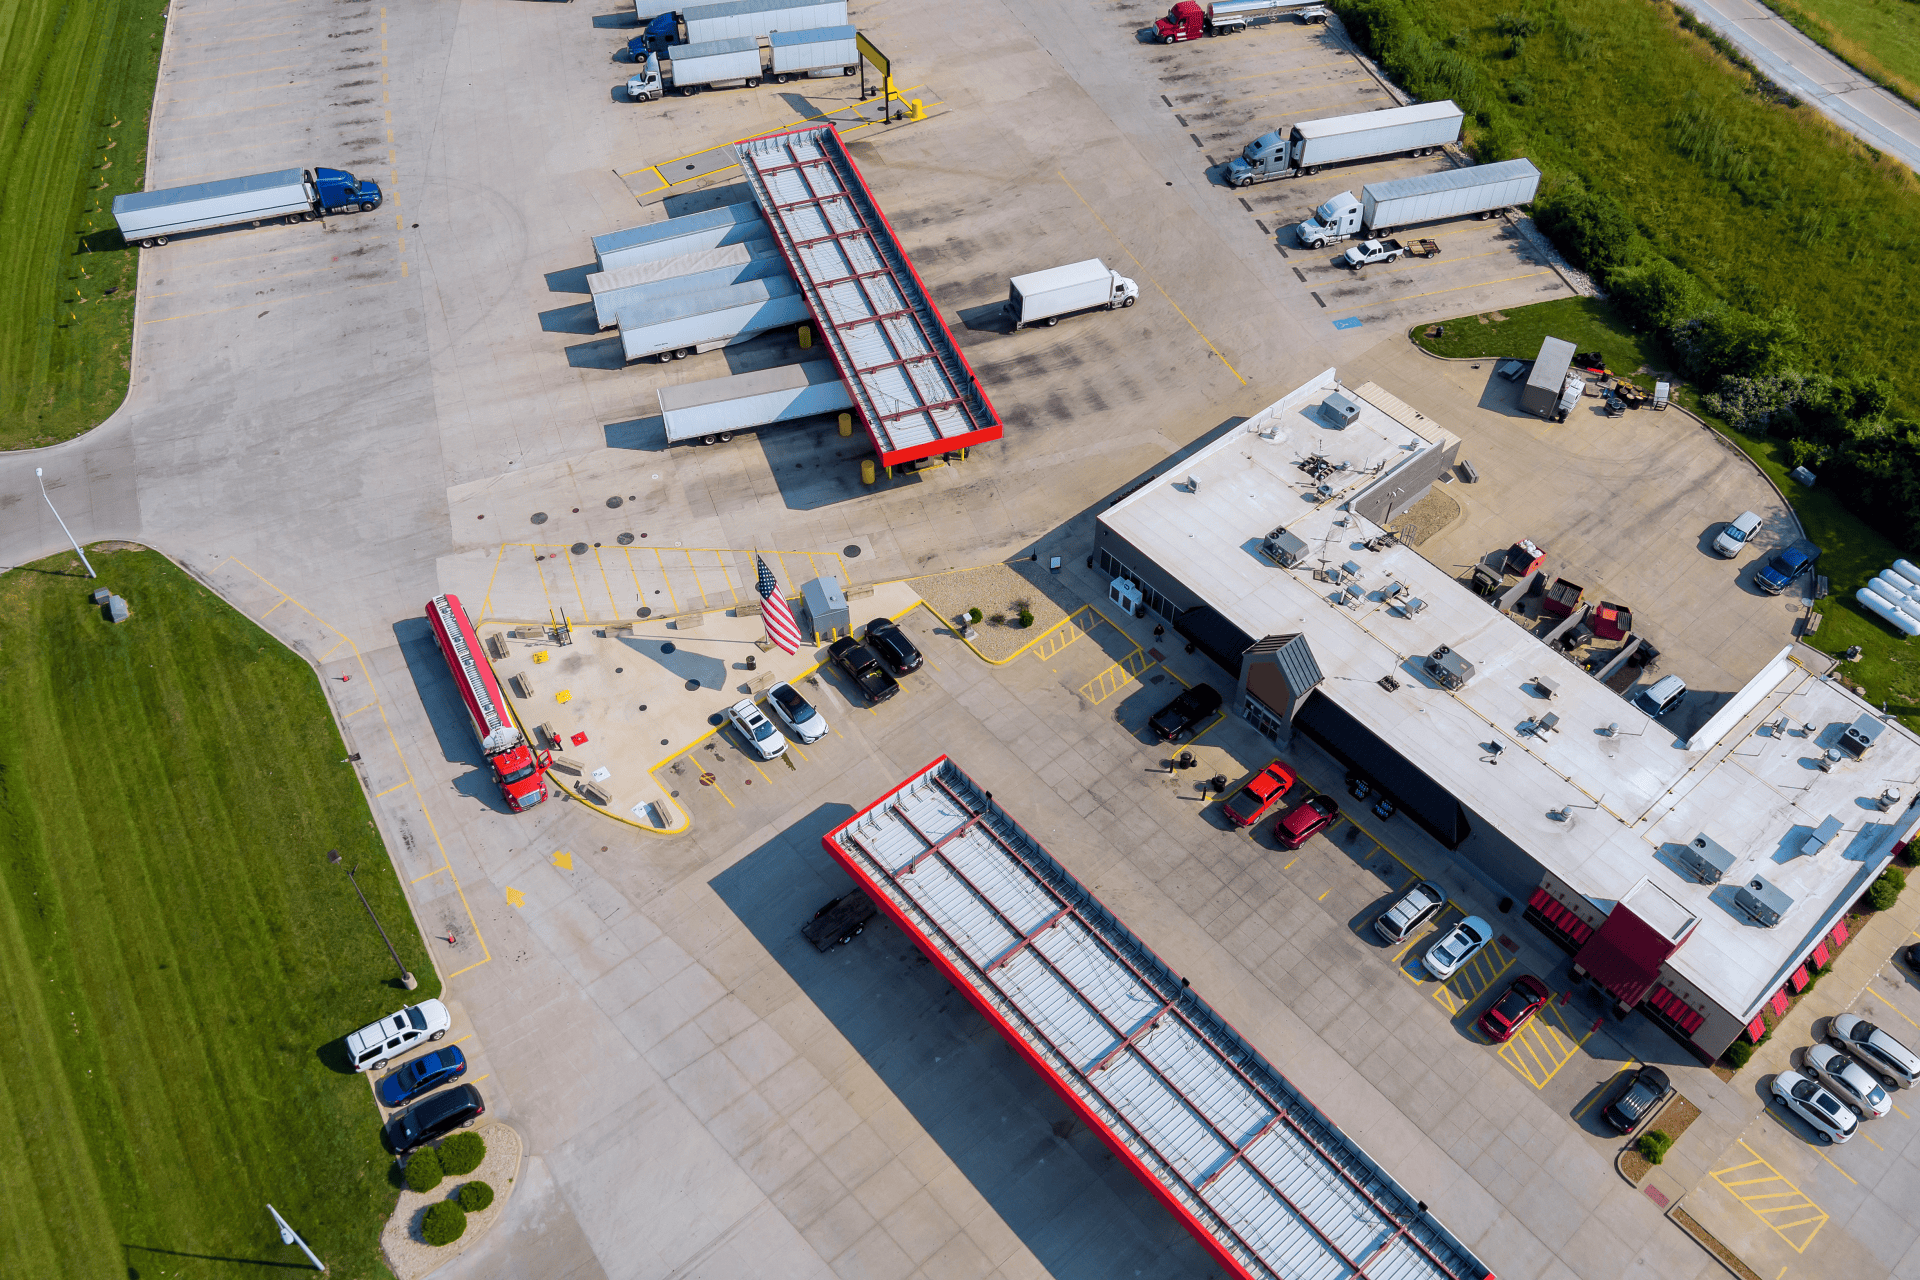
Leverage stop duration, vehicle mix, and trip volume to forecast precise demand for loading docks, trailer parking, employee spaces, diesel or gasoline lanes, and EV chargers—ensuring any fuel station, warehouse, or distribution hub is built to match real-world traffic.
See exactly when commercial traffic bypasses your site for a rival’s—then track how targeted promos, or service upgrades win those turn-ins back.
Combine corridor flow, origin–destination routes, and stop analytics to compare any parcel against nearby alternatives. Instantly see which site captures the most commercial gallons today and which one will grow fastest tomorrow.
Altitude processes billions of anonymous trips to deliver segmented traffic data that pinpoints your ideal commercial customer. Developers, retailers, and investors use single source commercial vehicle movement insights to de-risk builds, right-size upgrades, and accelerate returns.
Experience comprehensive retail site selection with contextualized transportation data. Book a demo to discover how you can identify optimal locations and enhance your site selection strategy.